




An Independent Analysis of RDN Recovery Data and Equifax Credit Trends Points to a 2026 Plateau After Years of Rising Repossessions
As many of you may recall, in 2025, we began reporting repossession and assignment volumes provided by Recovery Database Network (RDN). This represented a significant development in repossession industry reporting. Until then, much of the industry’s understanding of national repossession volume had relied on estimates published by Cox Automotive.
What made the RDN data particularly valuable was its foundation in actual completed recoveries and unique vehicle identification numbers recorded through the industry’s largest repossession assignment platform. Unlike estimates derived from late-stage auto loan defaults and wholesale auction trends, these figures offered a more direct look at repossession activity.
The substantial differences between the two measures attracted attention from news organizations around the world and raised important questions about the industry’s actual volume.
When our access to that reporting became unavailable, it left a significant information gap at a time when lenders, recovery companies, and other industry participants needed reliable benchmarks.
But the RDN data had already left us a trail of breadcrumbs. And those breadcrumbs, combined with publicly available Equifax auto loan delinquency data, became the foundation for a new approach to measuring America’s repossession industry.
Methodology
Our methodology combines RDN’s previously reported completed vehicle recoveries with Equifax auto-loan delinquency data to develop an independent estimate of U.S. repossession volume.

Using RDN’s unique-VIN recovery figures as our foundation, we measure the historical relationship between completed repossessions and the number of auto-loan accounts 60 or more days delinquent. A rolling calibration is then applied to estimate quarterly and annual repossession volumes where direct recovery data is unavailable.
Historical trends and available RDN observations are used to test and refine the estimates. Assignment volumes are separately modeled using estimated assignment-to-recovery ratios.
The objective is not to produce a precise census of every repossession, but to establish a consistent, data-driven benchmark for identifying industry trends, changes in recovery activity, and potential turning points.
Nearly Two Decades of Repossessions: The Rise, Fall, and Return of Recovery Volume
Annual Repossession Volume
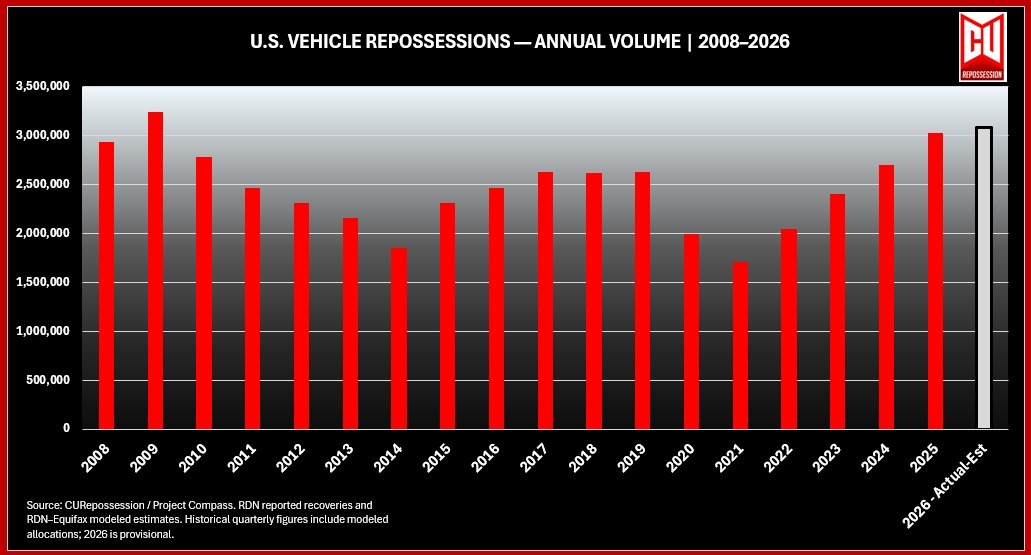
The annual estimates reveal nearly two decades of significant fluctuations in America’s repossession industry. Following a peak of approximately 3.2 million recoveries in 2009 during the Great Recession, volumes declined considerably before recovering in the latter half of the 2010s. The pandemic brought another sharp contraction, with estimated recoveries falling to approximately 1.7 million in 2021.
Since then, repossession activity has rebounded dramatically, climbing toward three million annual recoveries. Our preliminary 2026 estimate of approximately 3.08 million suggests that the industry may be approaching a plateau, although at levels not seen since the aftermath of the financial crisis.
Quarterly Repossession Breakdown
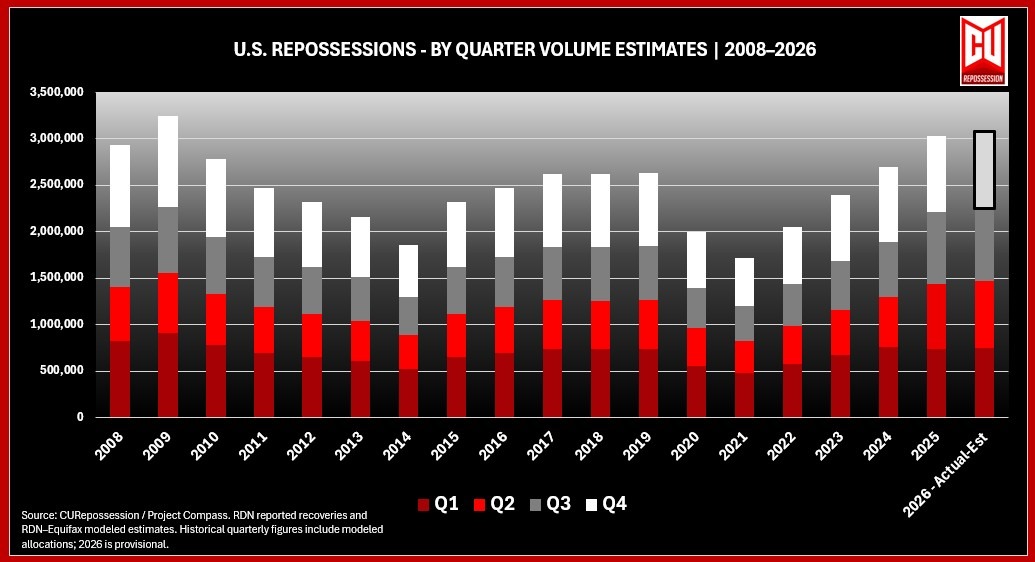
Breaking annual recovery volumes into individual quarters provides a closer look at how repossession activity develops throughout the year. The chart illustrates the estimated quarterly contributions to each year’s total, highlighting the prolonged decline following the financial crisis, the sharp pandemic-era contraction, and the sustained recovery beginning in 2022.
While much of the historical quarterly distribution is modeled rather than directly reported, the chart provides a consistent framework for comparing recovery activity over time. The relatively modest projected increase in 2026 reinforces the possibility that repossession volumes are stabilizing after several years of substantial growth.
Nearly Two Decades of Assignments: The Growing Demand Behind the Recoveries
Annual Assignment Estimates
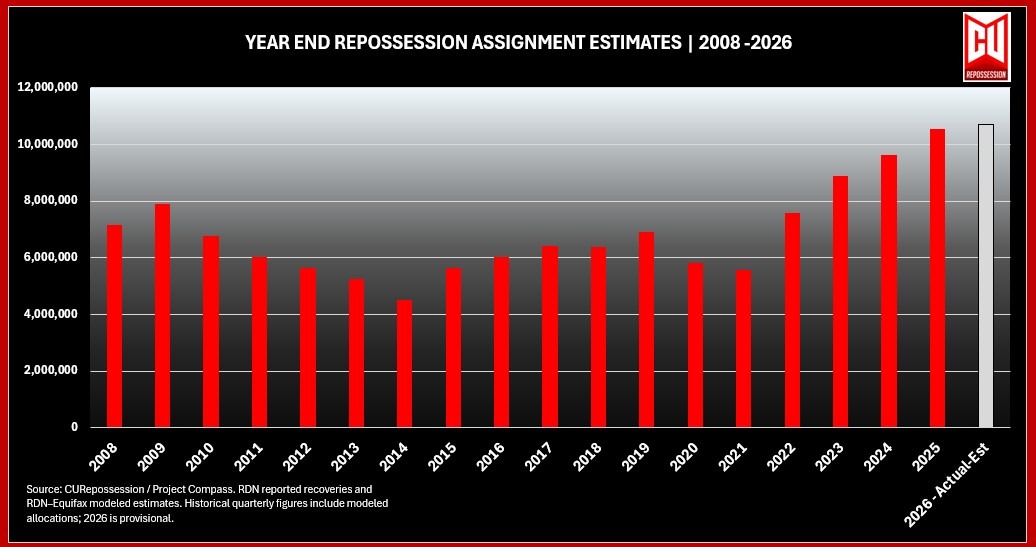
While completed repossessions measure vehicles successfully recovered, assignment volumes provide a broader picture of the industry’s workload. Not every assignment results in a recovery, and some accounts may be canceled, withdrawn, or reassigned before a vehicle is located.
Our modeled estimates suggest that annual repossession assignments have climbed substantially since the pandemic, reaching approximately 10.5 million in 2025, with a modest increase projected for 2026. This represents more than three times the estimated number of completed recoveries, illustrating the substantial difference between modeled assignment demand and completed recovery volume.
The growing difference between assignments and recoveries also raises questions about recovery efficiency, assignment quality, and the operational demands placed on repossession companies.
Quarterly Assignment Breakdown
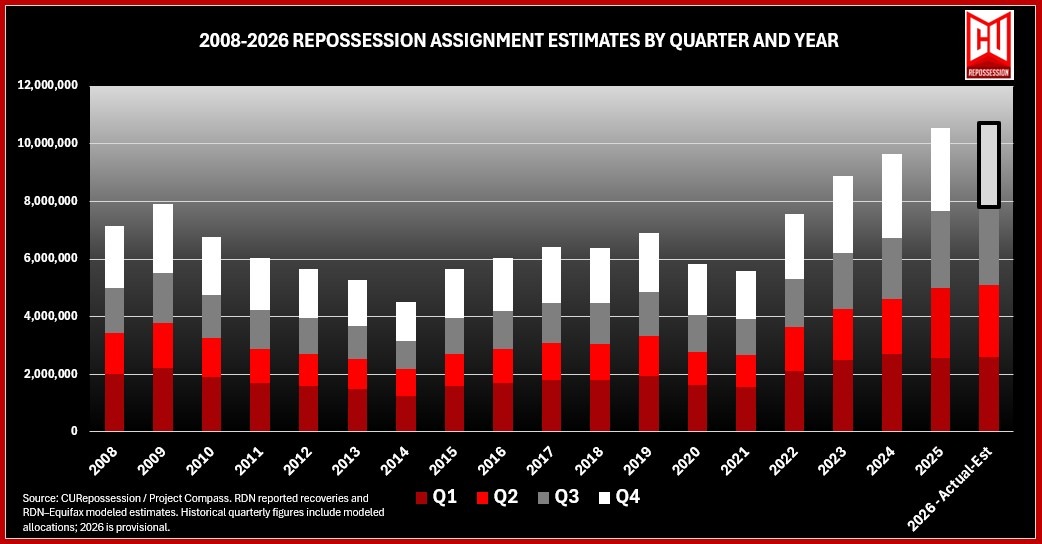
The quarterly estimates illustrate how repossession assignment activity has changed over nearly two decades, from the elevated volumes surrounding the financial crisis through the prolonged decline that followed, and into the renewed growth of recent years.
Since 2021, modeled assignment volumes have risen sharply, reflecting both increasing recovery demand and the assumptions used to estimate assignment-to-recovery ratios. The projected 2026 figures suggest that assignment activity may be stabilizing at historically elevated levels, even as completed repossession volumes begin to level off.
Unlike completed-recovery figures supported by direct RDN observations, these historical assignment estimates rely more heavily on modeled recovery ratios. They are intended to illustrate the potential scale and direction of industry workload rather than provide a precise count of individual assignments.
Data Notes and Limitations
The figures presented in this report combine previously reported Recovery Database Network (RDN) data with historical modeling based on Equifax auto-loan delinquency trends. Where actual RDN recovery figures were available, they were used to establish and evaluate the model. Other periods, including portions of the historical quarterly series, rely on estimates and reconstructed quarterly distributions.
Assignment volumes are modeled separately using estimated assignment-to-recovery ratios. These figures represent estimated original lender assignments and do not include additional placements or reassignments through repossession forwarders. Accordingly, they should not be interpreted as a complete accounting of all assignments received by recovery agencies.
The 2026 figures are preliminary projections and remain subject to revision as additional recovery and delinquency data becomes available. While the model has been tested against available RDN observations, its historical estimates and forecasting accuracy remain subject to the limitations of the underlying data.
This research is independently developed by CURepossession using third-party data and is not an official report or forecast issued by RDN or Equifax.
As additional information becomes available, future reports may expand beyond national repossession and assignment volumes to examine forwarder activity, reassignment patterns, recovery rates, and other operational trends. These additional measures could provide a more complete understanding of the industry’s workload and performance.
For an industry that has long struggled to establish a consistent measure of its own activity, this research represents a starting point rather than a finished product. As additional recovery and assignment data becomes available, the estimates will be refined, the trends reassessed, and the picture of America’s repossession industry brought into sharper focus.
Three Million Repossessions: A New Measure of America’s Recovery Industry – Three Million Repossessions: A New Measure of America’s Recovery Industry – Three Million Repossessions: A New Measure of America’s Recovery Industry
Stay safe!
Kevin Armstrong
Publisher
editor@curepossession
Related Articles:
RDN Repossession Volume Report – Q3 2025
RDN Repossession Volume Report – Q2 2025
Repossession Volume Remains Strong in Q1 25’
Uncovering the True Size of the Repossession Industry in 2024
Repossession Assignment Volume UPDATED – 2008-2024
2008 -2024 Repossession Volume – 17 Years of Crisis and Comeback
CFPB Issues First Detailed Repossession Data Report
Three Million Repossessions: A New Measure of America’s Recovery Industry – Repossess – Repossession – Repossession Agency – Repossessor – Repossession – Repossession News – Repossession History






More Stories
Why Fight LPR? Join It — But What Happens When the Car Repossesses Itself?
In The Future Will There Be Anyone Left to Recover Vehicles?
The Broken Bond Between Lenders and Agents – Positive Resolution
The Repos That May Never Come
A Repossession Is a Repossession
When “Partner” Is Just Another Word for Vendor