Fees, Time to Repo, Forwarder Assignment Volume, Recovery and Redemption Rates
On Thursday the 23rd, the Consumer Financial protection Bureau (CFPB) issued their long-awaited report on lender repossession data. Within its pages are reports confirming that repo activity has surpassed pre-pandemic levels and it furthermore affirms the increased percentage of forwarder assigned accounts and their added costs of repossession.
As many of you will recall, back in March of 2023, the CFPB issued a directive to a select number of their supervised lenders to report to them a large number of repossession related data for them to compile in order to access the state of repossession practices. It’s taken awhile for them to get them together, but they will come as little surprise and affirm what many in the repossession industry already know.
Read Our March 23′ Article: CFPB Sets Sights on Repossession Data and Trends
Prefacing their findings, the CFPB did unsurprisingly find gathering consistent data from some lenders was a challenge, stating: We note here certain limitations in the repossession data received. The orders requested that, for accounts serviced between 2018 and 2022, recipients provide information for all repossession assignments and for all completed repossessions. However, one lender only retained information for the most recent repossession assignment and completion if the account had been assigned to repossession more than once. This lender represents a small fraction of the total accounts assigned to repossession at least once.
Additionally, some lenders did not retain detailed information for repossession assignments that were later cancelled. For these accounts, lenders identified that a repossession assignment was cancelled but did not retain information on the status of the account at the time of assignment, such as the repossession assignment date or days past due at repossession assignment. As such, there may be certain details of repossession activity that are not captured in this report.
Also absent from the report, although requested, was data regarding the use of GPS devices and auto-interrupt devices. The report is also glaringly absent of any data regarding the use of license plate recognition technology (LPR). Regardless, the report is the most comprehensive study of repossession practices by any government entity that I have ever seen.
I genuinely hope they update this again. It would be nice to see this with more data in the near future.
Findings:
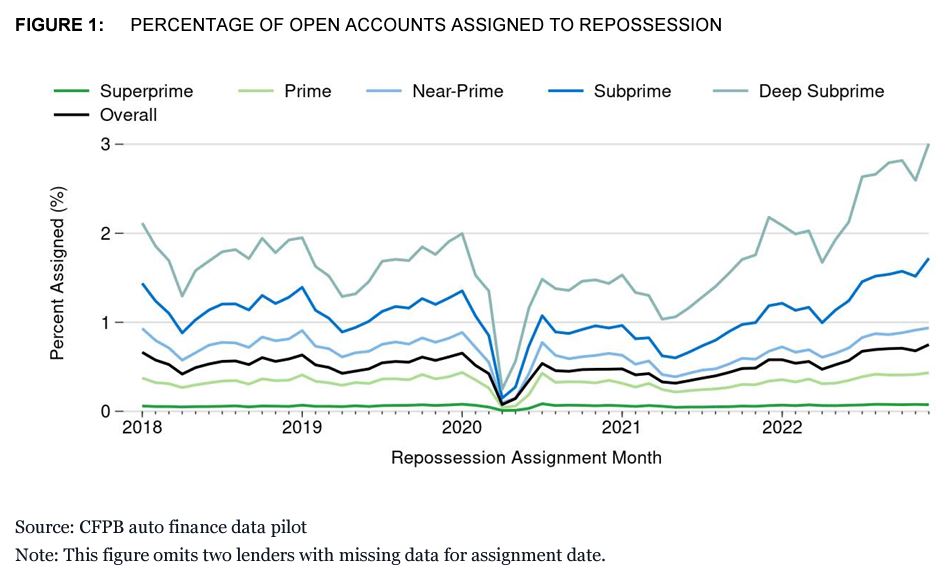
Repossession assignments surpassed pre-pandemic levels in 2022. In December 2022, 0.75 percent of all outstanding loans were enough days past due that the lender assigned the vehicle to a third party for repossession, referred to as “repossession assignments” later in the report. This represents a 22.5 percent increase from the December 2019 level of 0.61 percent.
The share of repossession assignments completed decreased in 2022 compared to 2019. In September 2022, which is the last month for which we have full information about the outcome of a repossession assignment, 27 percent of accounts assigned to repossession were completed, a decrease from the completion of 38 percent of repossession assignments when compared to September 2019.
The use of third-party repossession and recovery management services (referred to as “repossession forwarders” later in this report) by lenders in the dataset increased from 31 percent at the beginning of the data collection in January 2018 to 66 percent at the end of the data collection in December 2022. Outside a spike during the pandemic, use of repossession forwarders peaked at 69 percent in October 2022. Average repossession costs charged to consumers in the dataset were higher when a forwarder was used.
Consumers in 2021 were more likely to make payments sufficient to regain possession of their vehicle after a repossession had occurred (referred to in this report as “repossession redemption”) than consumers did pre-pandemic, but the level fell throughout 2022 as used car values declined. Thirty-four percent of repossessions completed in December 2021 were redeemed, an increase from 25 percent in December 2019. Redemptions fell to 30 percent by November 2022., which is the last month for we have complete data on redemptions.
Average outstanding balances for consumers with outstanding balances on their accounts after a vehicle was repossessed and sold by the lender were rising prior to 2020, then fell as used car prices increased post-pandemic (referred to later in this report as “deficiency balance”). Average deficiency balances among consumers with a deficiency balance in December 2019 were $10,747 but fell to $7,971 by December 2021 as used car prices increased. The average deficiency balance sharply increased throughout 2022. By December 2022, the average deficiency balance surpassed non-inflation adjusted 2019 levels at $11,340.
2.1 – Repossession Assignments
Repossession assignments occur when lenders indicate to a repossession agent or a repossession forwarder (repossession forwarders are discussed in more detail later in this report) that a vehicle is eligible to be repossessed. Repossession assignments may not ultimately end in repossession.
We again note that not all lenders in the cohort provided information on the date of repossession assignment. In our analysis of repossession assignment or completion trends that rely on repossession assignment date over time, we do not include accounts for which no repossession date was provided. Repossession assignments without dates represent about five percent of repossession assignments in the dataset but are mostly clustered in the prime and near-prime credit tiers. We therefore expect that levels of repossession activity in the dataset over time may have been higher than we report.
Throughout 2018 and 2019, in an average month 0.54 percent of open accounts were assigned to repossession. After the pandemic-related decrease in assignments in early 2020, repossession assignments decreased as a percentage of open accounts through the end of 2020 and into the beginning of 2021. Through most of 2021 and all of 2022, an increasing percentage of accounts were assigned to repossession, ending 2022 at 0.75 percent of open accounts.
Of note, the percentage of accounts for consumers with deep subprime credit scores assigned to repossession in 2018 and 2019 ranged from 1.3 to 2.1 percent of all open accounts. In April 2020, that percentage dropped to 0.2 percent but returned to 1.5 percent in July 2020. That percentage reached 1.3 percent in March 2021, and after a slight drop April 2021 rose to 3 percent by December 2022.
The percentage of accounts assigned to repossession for consumers with subprime credit scores ranged from 0.9 to 1.4 percent in 2018 and 2019. That percentage dropped to 0.1 percent in April2020 and returned to 1.1 percent in July 2020. After a slight drop in April 2021, the percentage of accounts assigned to repossession rose to 1.7 percent by December 2022.
2.2 – Voluntary Repossession
Some consumers voluntarily surrender the vehicle to the lender after falling behind on their payments or when notified that their vehicle is subject to repossession. Figure 2 shows the percentage of total completed repossessions that were noted in the data as voluntarily surrendered. 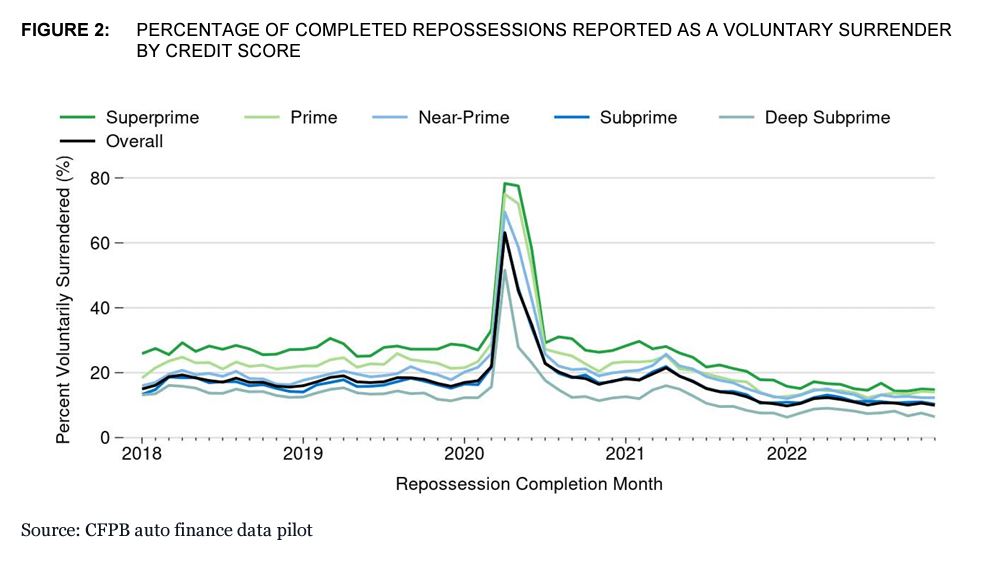
Voluntary repossessions represented between 15 and 19 percent of all completed repossessions in 2018 and 2019. In early 2020, voluntary surrenders spiked to 63 percent of completed repossessions. We note that during this time the number of completed repossessions dropped dramatically, and as such we note that increase in the percentage of voluntary surrenders is likely more a reflection of an overall decline in the number of involuntary repossessions rather than an increase in the total number of voluntary surrenders.
From late 2020 into early 2021, the percentage of voluntary repossessions returned to pre-2020 levels. In mid-2021 the percentage of voluntary repossessions dropped below pre-2020 levels and remained at approximately 10 percent of completed repossessions through the rest of 2021 and 2022.
Figure 2 also shows that completed repossessions for consumers with superprime credit scores were more likely to be voluntary when compared to consumers with subprime credit scores. Voluntary repossessions for consumers with superprime credit scores ranged from 25 percent to 31 percent of completed repossessions in 2018 and 2019. After a spike to 78 percent of completed repossessions in April 2020, voluntary repossessions for consumers with superprime credit scores ranged from 14 to 18 percent of completed repossessions between November 2021 and the end of 2022.
In contrast, voluntary repossessions for consumers with subprime credit scores ranged between 13 and 19 percent of completed repossessions in 2018 and 2019. Following a similar 2020 spike, voluntary repossessions were between 10 and 13 percent of all repossessions from November 2021 through the end of 2022.
2.3 – Completed Repossessions
In Figure 3 we look at the percentage of assigned repossessions completed by credit tier. Prior to 2020, lenders in the dataset completed 41 percent of all repossessions assigned in an average month.
Within all credit tiers, and consistent with overall repossession trends in this dataset as discussed earlier in the report, the percentage of completed repossessions spiked in April 2020 due to the high number of voluntary repossessions that month.
By the beginning of 2021, the percentage of completed repossessions for all credit tiers returned to pre-pandemic levels before experiencing a general decline through 2021 and 2022, with 27 percent of repossession assignments completed in September 2022. 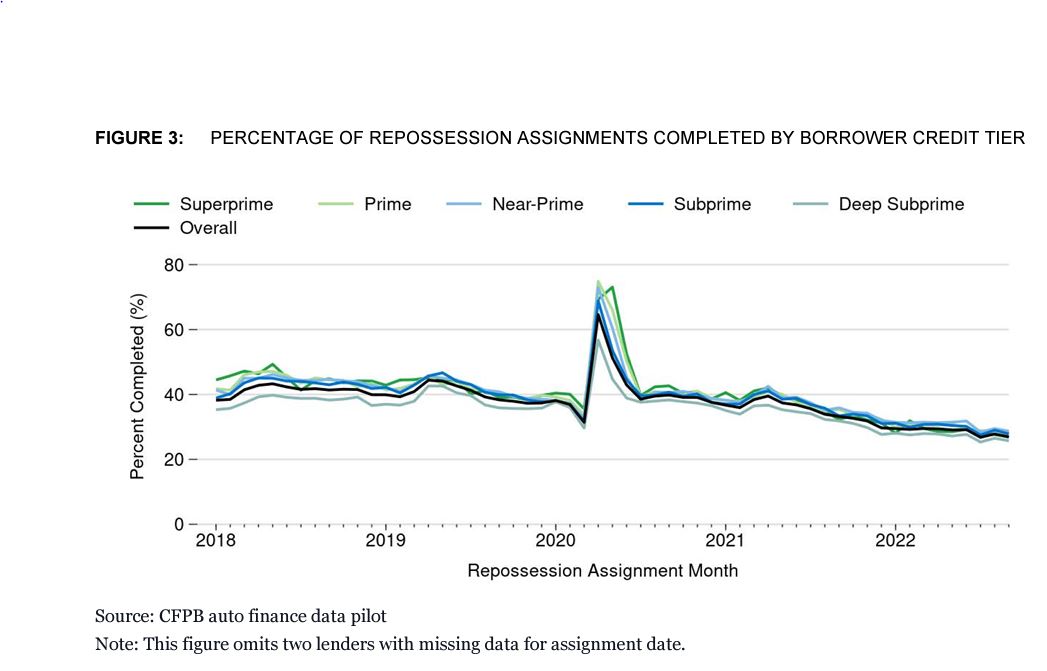
2.4 – Redemption
After the vehicle is repossessed and the lender takes custody of the vehicle, consumers are generally provided an opportunity to redeem the repossessed vehicle prior to disposal. In order to redeem the vehicle, the consumer is generally required to repay any outstanding balance on the loan plus any costs associated with the repossession (which are discussed in greater detail later in this report).
Figure 4 measures the percentage of completed repossessions that were redeemed. For all figures discussing the percentage of completed repossessions later redeemed, we do not show information for December 2022 since some of these repossessions may have been redeemed in 2023 and would therefore not be fully captured in our dataset.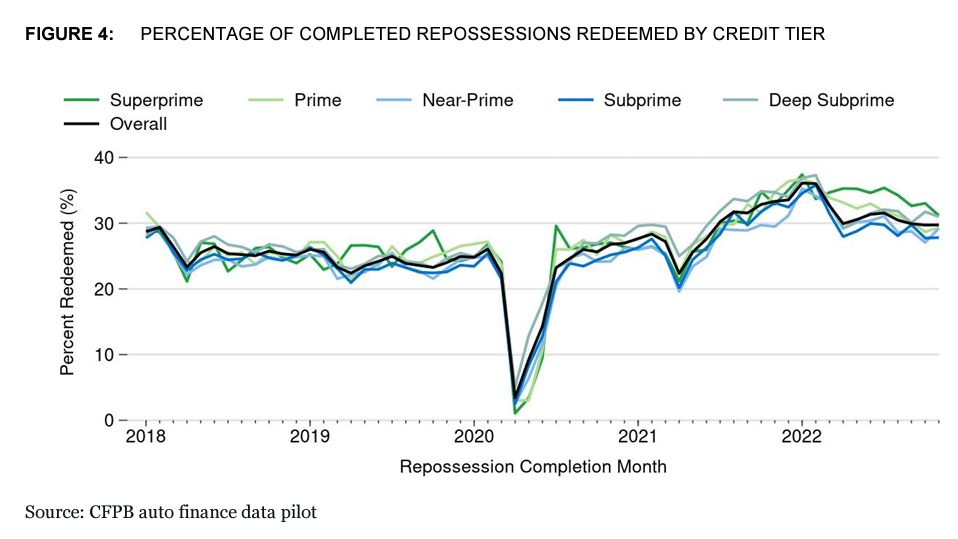
The percentage of redeemed repossessions prior to 2020 was relatively steady and within a band between 22 percent and 29 percent of all completed repossessions between January 2018 and March 2020. In early 2020, the percentage of redeemed repossessions dropped to 3 percent before returning to pre-pandemic levels through the middle of 2020 into early 2021.
Redemption percentages rose above 30 percent for the rest of 2021 and early 2022 before declining to slightly above pre-2020 levels.
This figure shows that percentage of redeemed repossessions for all credit tiers was fairly tightly grouped, but from mid-2020 until the end of 2021 consumers with deep subprime credit scores had redemption percentages slightly higher than other credit tiers. An increase in the percentage of redeemed repossessions for all consumers started in early 2021 and peaked in late-2021 before retreating to slightly above pre-2020 levels. The same trend held when analyzed by borrower income at origination.
2.5 Deficiency Balance
At the end of the repossession process, if the car is not otherwise redeemed the lender typically disposes of the vehicle. If the disposal is done through a sale, lenders are generally required to use a commercially reasonable process, which for many lenders is through an auction.
If the net proceeds of the sale do not cover the full amount owed to the lender and any costs associated with the repossession of the vehicle, including costs to clean and/or repair the vehicle ahead of resale, and/or costs related to the disposal of the vehicle, the result is a deficiency balance that the consumer may be required to repay. If the consumer cannot or does not pay the deficiency balance charged, a lender may decide to pursue the balance through formal collections processes and/or report the unpaid balance to a credit bureau.
If the net proceeds of the sale of the vehicle exceed the amount owed to the lender, the result is a surplus that is generally required to be returned to the consumer. In this section, we explore trends in deficiency balances. We do not report on deficiencies for January 2018, as some lenders did not include deficiency balance information for repossessions that were completed prior to our data collection even if the disposal occurred just after the start of 2018. Additionally, we exclude from our analysis disposals where lenders marked the existence of both a deficiency balance and a consumer surplus.
Of the 905,000 disposals in the dataset, 94 percent ended with a deficiency balance. In early 2020, at the same time as the overall drop in the number of repossessions, the share of disposals ending with a deficiency balance also dropped.
The share of disposals with deficiency balances rose from early 2020 through early 2021, dropping over the course of 2021. The drop during 2021 is consistent with the rise in used car prices over that time. The percentage of disposals with a deficiency balance dropped to 83 percent of all disposals in November 2021.
As used vehicle prices decreased, the total number of repossessions with a deficiency balance rose by the end of 2022, at which time 95 percent of disposals resulted in deficiency balances.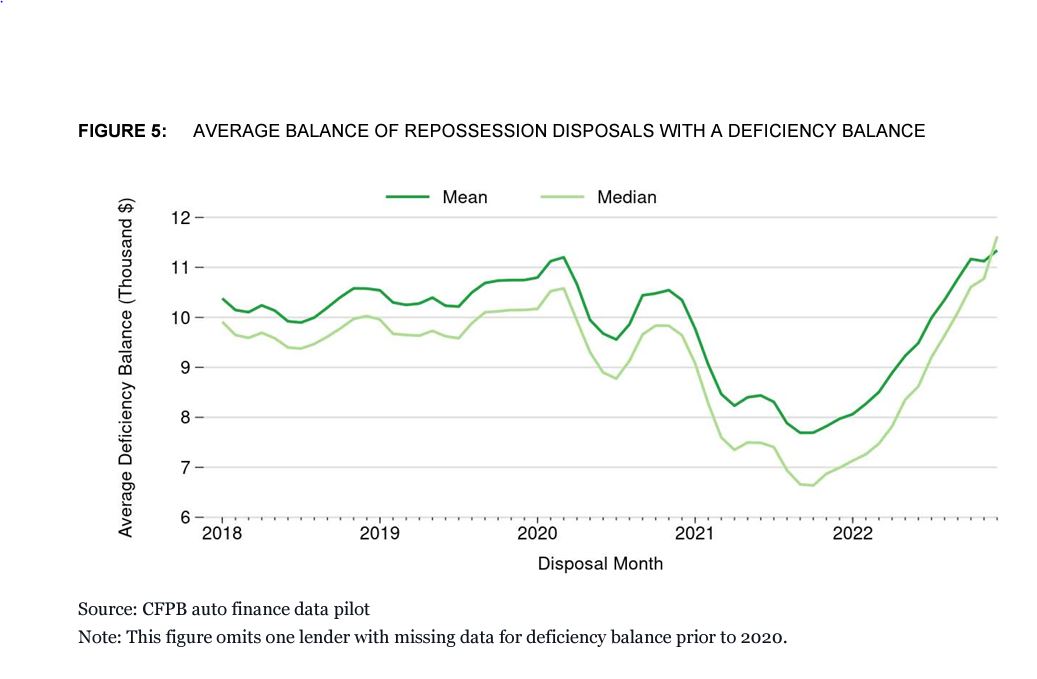
Figure 5 shows the mean and median deficiency balances for accounts with a deficiency balance. Pre-2020, the data showed that mean deficiency balances were generally rising. The mean deficiency balance among accounts with a deficiency balance rose 13 percent from its low point of $9,897 in July 2018 to $11,201 in March 2020.
Mean deficiency balances among accounts with a deficiency balance fell in early 2020, then grew through the remainder of 2020 and in early 2021. In connection with the rise in used car prices, the mean deficiency balance for accounts with a deficiency balance fell 27 percent from $10,544 to $7,692 between November 2020 and September 2021. Mean deficiency balances rose 47 percent from their low point in September 2021 to $11,340 at the end of 2022.
The median deficiency balance generally tracked lower than the mean. Median deficiency balances among accounts with a deficiency balance fell from $9,833 in November 2020 to $6,660 in September 2021 and then rose again to $11,620 by December 2022.
3.0 – Timing of Repossession Completion
Figure 6 shows the mean and median number of days between repossession assignment and completion. This figure shows a difference in the mean and median days between repossession assignment and repossession completion in the dataset, suggesting that some repossessions in the data took a relatively long time to complete.
The average number of days between repossession assignment and completion ranged from 15.9 days for consumers with superprime credit scores to 23.1 days for consumers with subprime credit scores.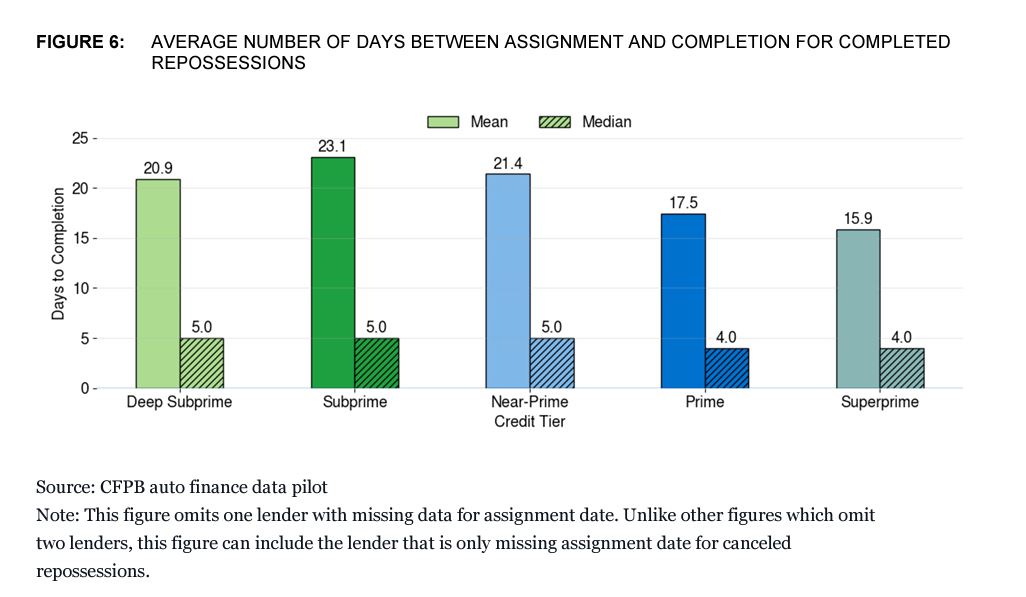
We also looked at whether voluntary repossession affected the analysis. The mean days to completion are two to four days longer and median days to completion are one day longer when voluntary repossessions are excluded from the analysis.
4.0 – Repossession Costs
When a repossession is completed, lenders generally charge consumers for the costs incurred from the repossession process. Costs charged to consumers in a repossession can include (but are not limited to) vehicle recovery, towing fees, costs for use of a flatbed tow truck or specialized equipment to tow certain vehicles without damaging them, storage fees, fees for securing and storing personal property, attorney fees, or other fees. The analysis covers vehicle disposal fees that occur after repossession separately from fees incurred during the repossession.
We note for this analysis that some lenders reported that they charge a flat fee to consumers regardless of the amount agents or forwarders billed to the lender. In this analysis, the amount lenders reported as actually charged to consumers is reflected.
Other lenders did not report an itemized list of the different repossession-related fees charged to the consumer, but they did provide the total amount they charged to the consumer. As such, the analysis included in this report is confined to the total amount reported as charged to consumers in the dataset and does not analyze these fees individually.
Additionally, we removed the top one percent of repossession fees and removed accounts where repossession fees were reported as negative to guard against outlier data. Finally, one lender could not provide data for all years requested, and as such that lender’s data is excluded from the analysis of repossession fees and costs.
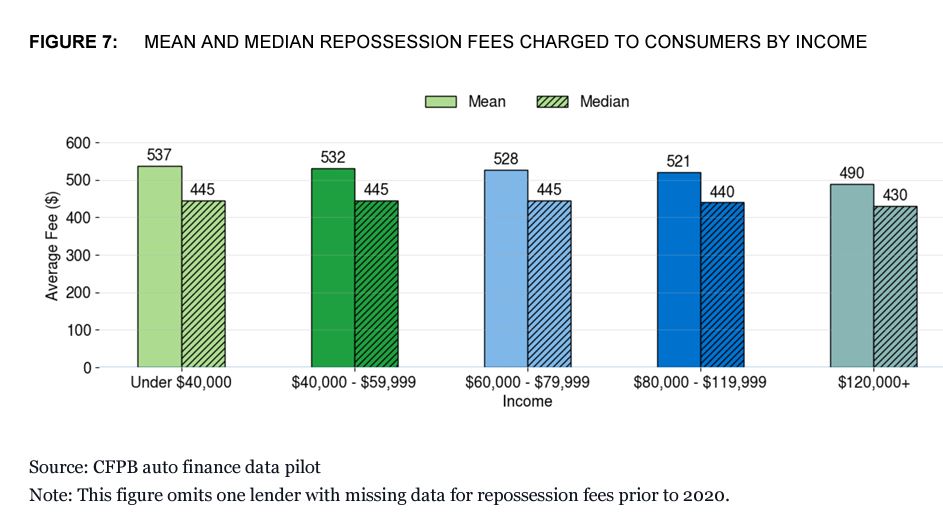
In Figure 7, we see that mean and median repossession fees charged to consumers across income levels were generally similar, However, we note that mean and median fees charged to consumers in the highest income group are lower. Analysis by credit score showed that consumers with higher credit scores generally had lower average fees than those charged to consumers with lower credit scores.
5.0 – Repossession Forwarders
In the past, lenders generally directly managed relationships with repossession agents who, for a fee, found and took possession of vehicles on behalf of a lender in the repossession process. Third-party repossession forwarding companies emerged, offering to manage the repossession process and relationships with repossession agencies for lenders instead.
Anecdotal evidence suggested that the use of repossession forwarders has grown, but publicly available data measuring their use and the potential impacts of that shift were missing. The use of forwarders is generally touted as a means for lenders to outsource the management of repossession assignments and repossession agents, and as a way for lenders to reduce their costs in doing so.
However, the use of forwarders also creates potential consumer and lender risk. Inserting a third-party intermediary into the process adds an additional layer of communication that must be managed effectively. If a borrower takes a last-minute step to avoid repossession (such as catching up on missed payments or negotiating an accommodation), the lender notifies the forwarder rather than communicating directly with the agent.
The forwarder must then ensure the repossession agent is promptly notified to avoid a wrongful repossession. This same dynamic may also affect communications from a repossession agent back to the lender. With this dataset, we explore the use of repossession forwarders and take a deeper look into whether any differences existed between repossessions involving forwarders versus repossessions in which the lender worked directly with the repossession agent. Figure 10 illustrates the use of repossession forwarders for lenders in this dataset.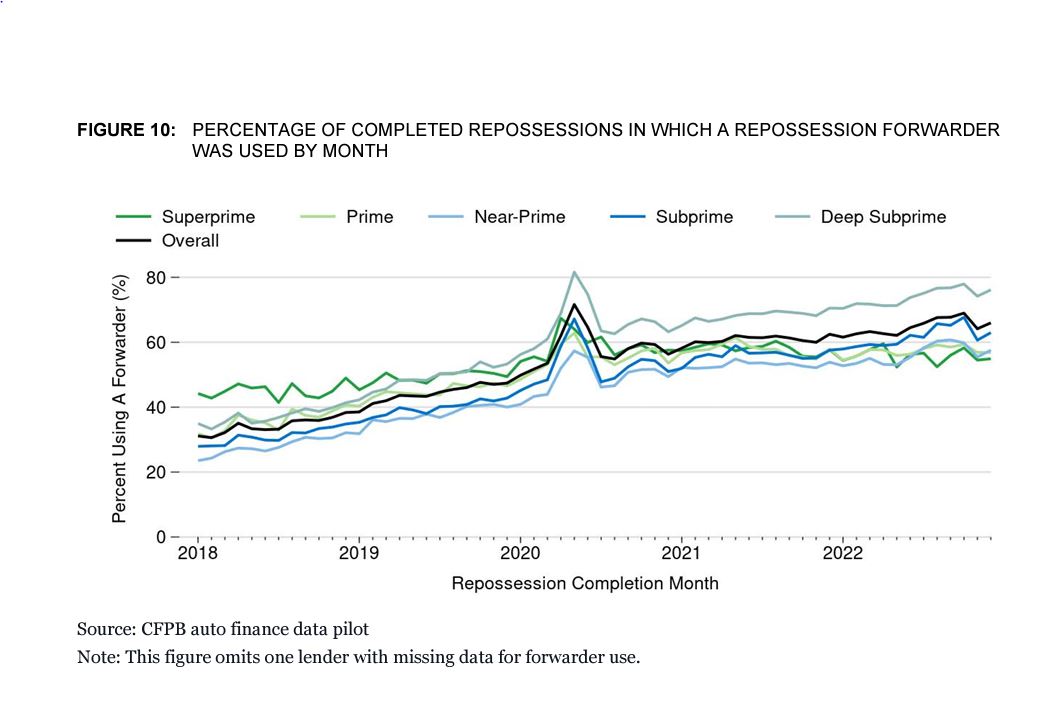
Figure 10 shows that forwarder use rose from 31 percent of all completed repossessions in early 2018 to over 50 percent of completed repossessions in February 2020. Completed repossessions using a forwarder showed a sharp increase in mid-2020. After that spike, repossession forwarder use rose from 55 percent in August 2020 to 69 percent of all completed repossessions in October 2022 before falling into the mid-60 percent range by December 2022.
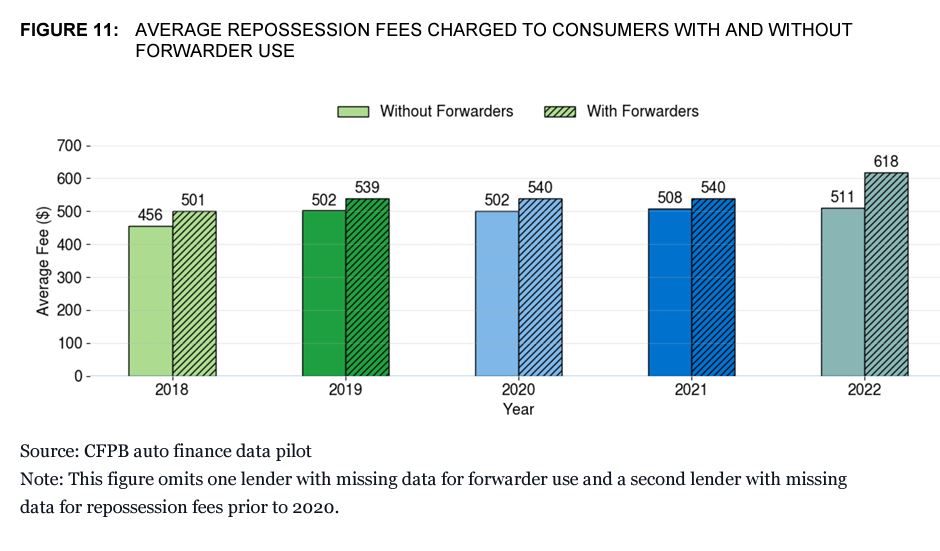 In Figure 11, we see that over time average repossession fees charged to consumers in connection with completed repossessions carried out using a forwarder were higher than those carried out without the use of forwarders.
6.0 – Conclusion
The auto finance data pilot dataset provides an unprecedented view into repossession compared to what publicly available data currently provide. The data show that repossession assignments increased for certain consumers post-2020, but that many consumers avoided repossession in parts of 2021 and 2022. The data show that, for lenders in the dataset, repossession forwarders were increasingly involved in repossession activity and that repossessions carried out through forwarders may have resulted in increased repossession costs passed on to consumers.
Our previous report on negative equity showed the potential downside of decreasing used car prices for consumers. We note that the data in this report indicate that deficiency balances rose significantly in 2022 as car prices declined in value. While decreasing prices are a benefit to current buyers, those consumers with loans on vehicles with higher-than-average depreciation may find themselves with a larger unpaid balance relative to their vehicle value than they might expect.
The data provide insight into the timing of repossessions after missed payments, information that up to now was not readily publicly available. All of these attributes of repossession have potential impacts on consumer risk, and a fuller understanding of the contours of repossession is a step toward assessing the potential risk.






More Stories
Repo Agent Wrestles Shotgun from Borrower
Breaking the Routine – Finding the Sweet Spot in Weekend Recoveries
Repo Rampage in Rural Texas
ARA Served Letter of Inquiry by Senator Warren
Arrest Made for Attempted Murder of Repossession Agent
Detroit Repo Shooter Sentenced