


2.5M repossession assignments, improved recovery ratios and strong recovery volume in the first quarter of the year
With the first quarter of 2025 well behind us, we can start looking further ahead into the year on where we may be going. New data made available to us from Recovery Database Network (RDN) has given us the hard numbers that reveal that the high levels of repossession volume we saw in 2024 are far from over.
On March 25th (last month) we released our updated repossession numbers provided to us from RDN that laid out 2024 as the highest levels of repossession volume since 2010. Previous to that we had relied upon the Cox Automotive model when we had developed our report 2008 -2024 Repossession Volume – 17 Years of Crisis and Comeback.
The only problem with the Cox auto model, was that it relied upon assumptions of repossession volume based solely upon a rate of 80% of all auto loans reported 90 days delinquent or more as reported to Equifax. What we found was that the Cox Automotive model reported data was 49% lower than the ACTUAL numbers being assigned and repossessed by RDN.
Given the choice between an estimate based on assumptions and hard factual numbers from the largest SaaS repossession assignment portal in the industry, we obviously followed the hard data.
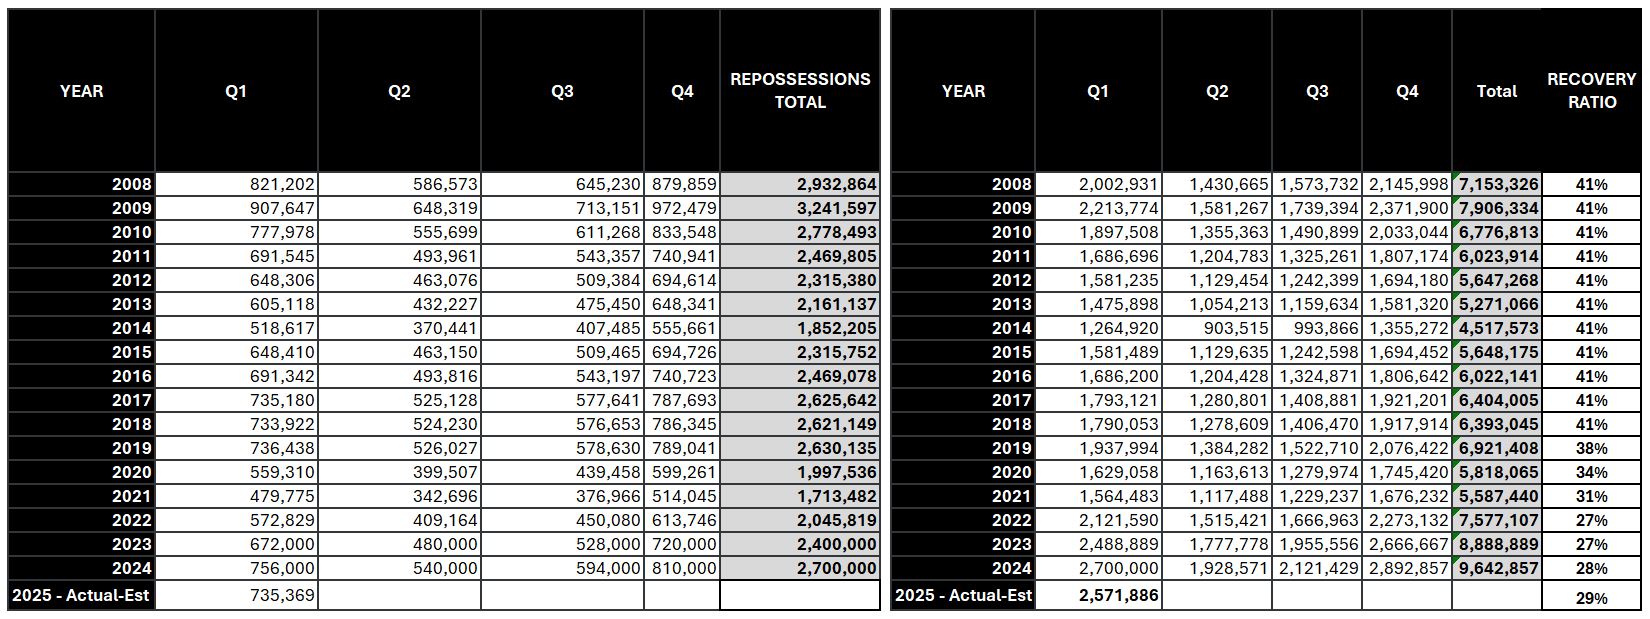
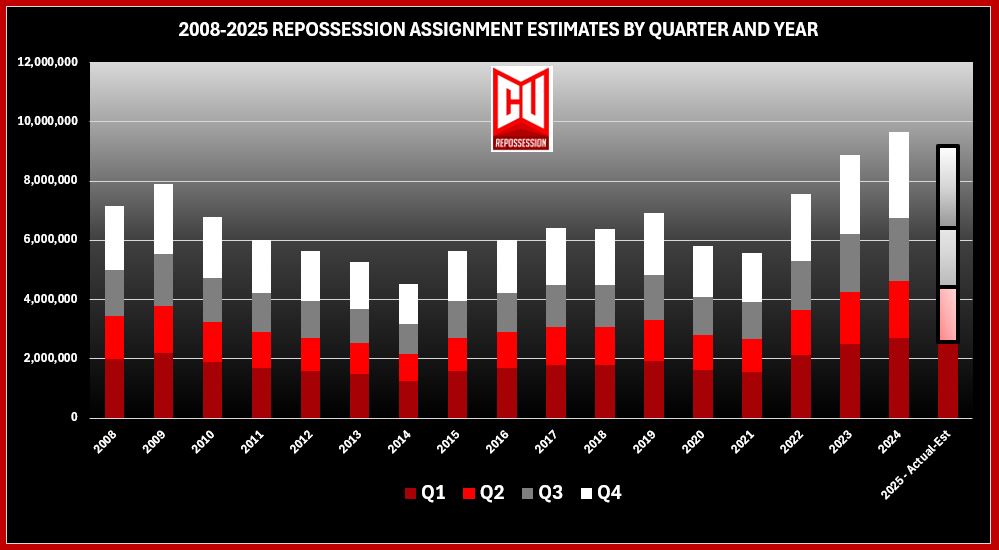
After backfilling in the ratio of difference between the two, we updated the pre-2022 data to provide a more accurate picture of the 2008 to 2024 repossession and assignment volume. Having received new data from RDN, we have updated it once again and it appears as though 2024’s volume highs are far from over.
Assignment Volume
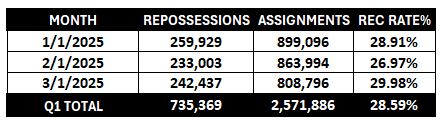
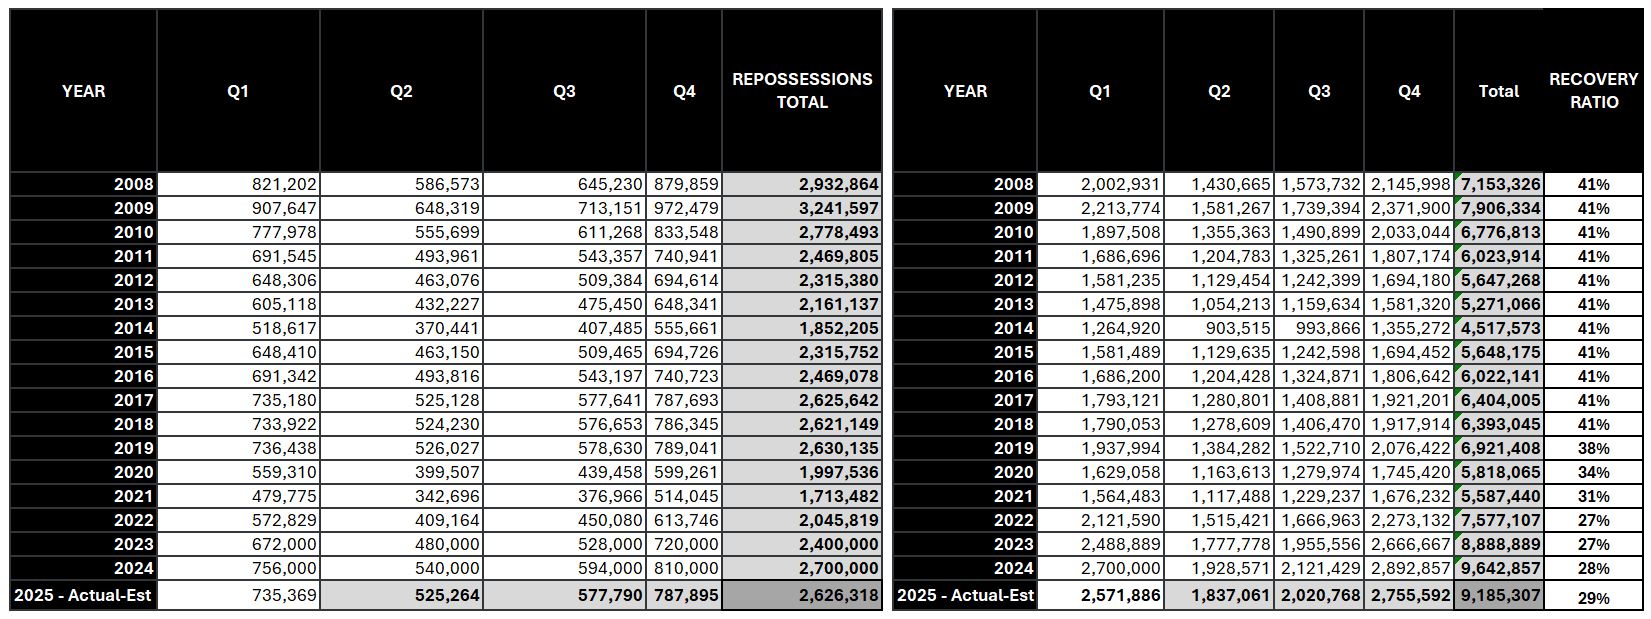
According to RDN, there were 2,571,886 unique repossession assignments received in the first quarter of the year. In other words, no two assignments were sent on the same vehicle.
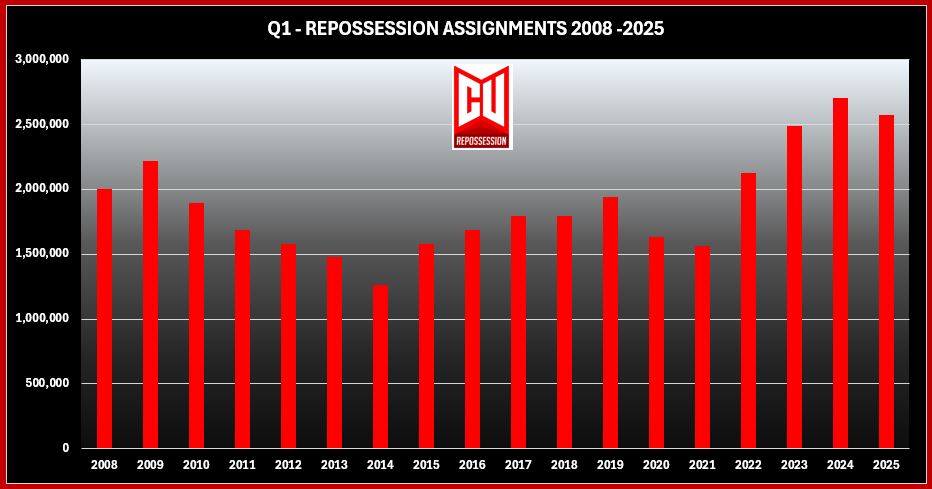
- January started strong with 899,906
- February, a short month, showed a slight drop to 863,994.
- March showed a significant drop down to 808,796
March’s drop off could be the result of tax refunds or continued lender efforts to modify loans, but that is a difficult thing to be sure of until the 1st quarter 2025 lender call reports become available. Either way, this is the precursor to actual repossessions.
Recovery Ratios
All of that repo assignment volume is great but means little unless those vehicles are actually being recovered. As mentioned in our last report, RDN had reported a recovery ratio of 27% for 2023 and 28% for 2024. These are consistent with the 2021 and 2022 with the 27% ratio reported by the CFPB on their January 25’ repossession study.
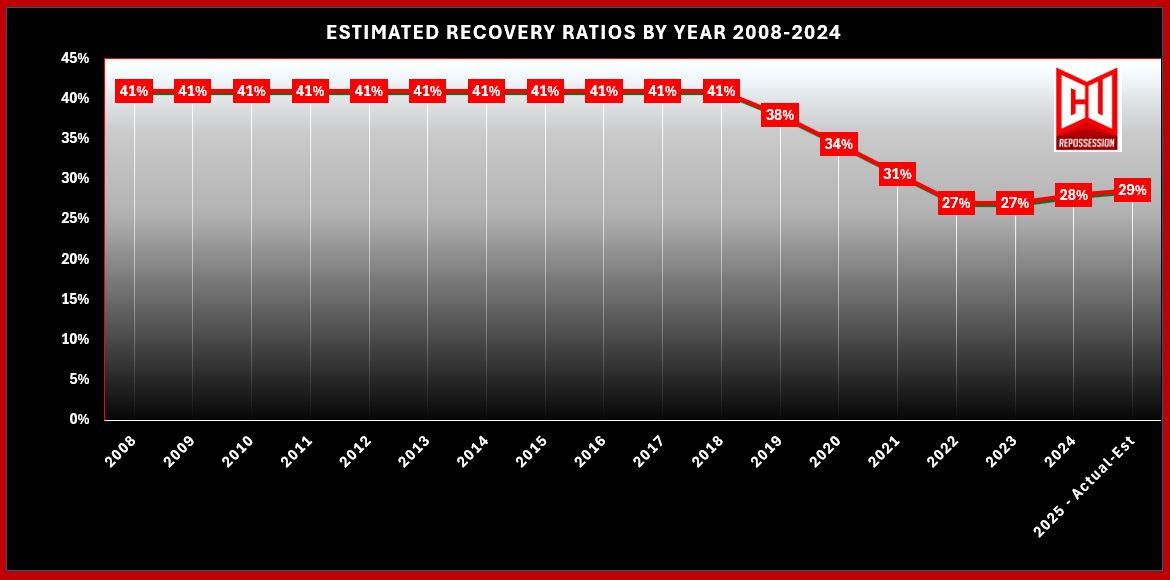
According to RDN, in Q1 of 2025, this ratio improved to 29%. While this is progress, it is still a far cry from the CFPB’s reported rate of 41% for the periods of January 2018 to April of 2021.
Repossession Volume
With a 29% recovery ratio for the quarter, Q1 ended with 735,369 repossessions.
- January started strong with 259,929
- February, a short month, dropped to 233,003.
- March, fortunately, came back with 242,437
Traditionally, the first quarter of the year holds the second highest repossession volume of the year. Now that we have that behind us, we can begin to model out the remainder of the year.
Looking Ahead
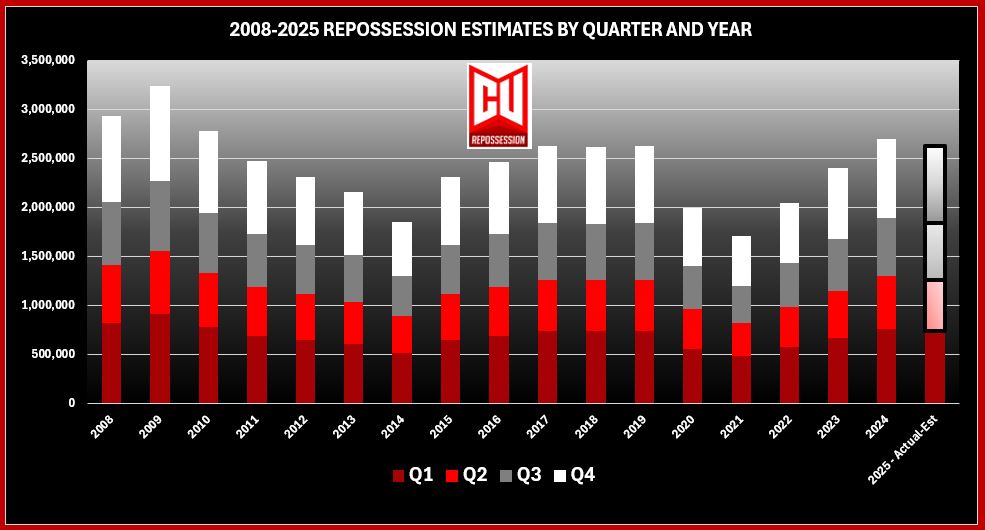
Looking back to the Cox Automotive model for guidance, we discovered their quarterly ratios of end of year volume by quarter. By their model, 28% of all repossessions occur in Q1. Applying that to what we already know, we can assume:
Assignments:
Q2 – With 20% of the average annual repo assignment volume, this quarter should end with 1,837,161 vehicles assigned.
Q3 – An estimated 22% of annual recoveries, should end with 2,020.768 assignments.
Q4 – End of year and the busiest quarter of the year representing an estimate 30% of all volume, if all goes as expected, should end at an estimated 2,755,592 assignments.
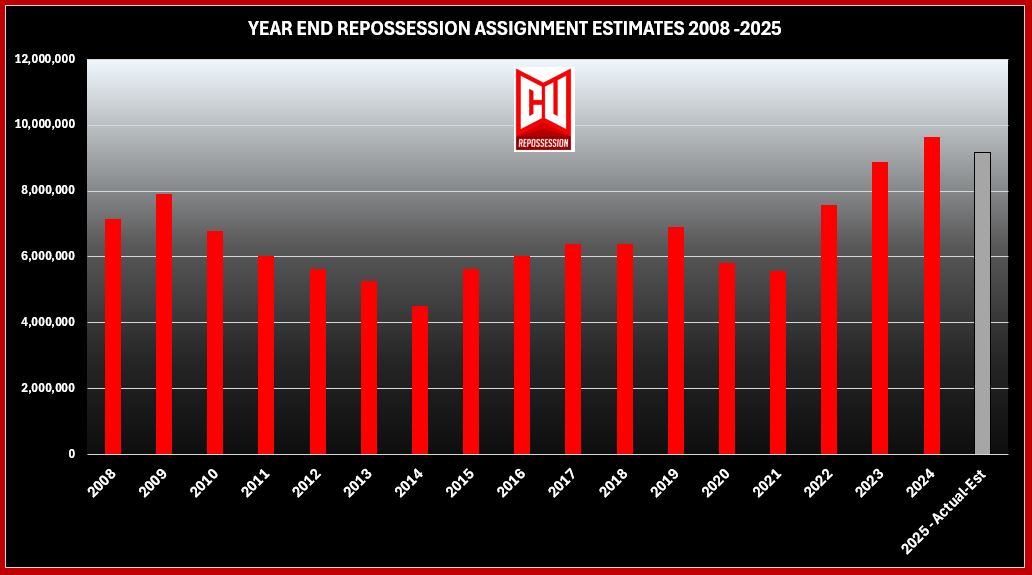
If all ratios remain stable and barring any massive improvements or declines in the economy, the industry should end the year with an estimated 9,185,307 assignments by year end. This marks the second highest repossession assignment volume in our short period of recorded history.
Repossessions:
Q2 – Sticking with the same 20% repossession volume ratio, this quarter should end with 525,264 vehicles repossessed.
Q3 – Using the 22% estimate of annual recoveries, mid-year should end with 577,790 recoveries.
Q4 – 30% of all repossessions; the big show. This quarter should end at 787,895.
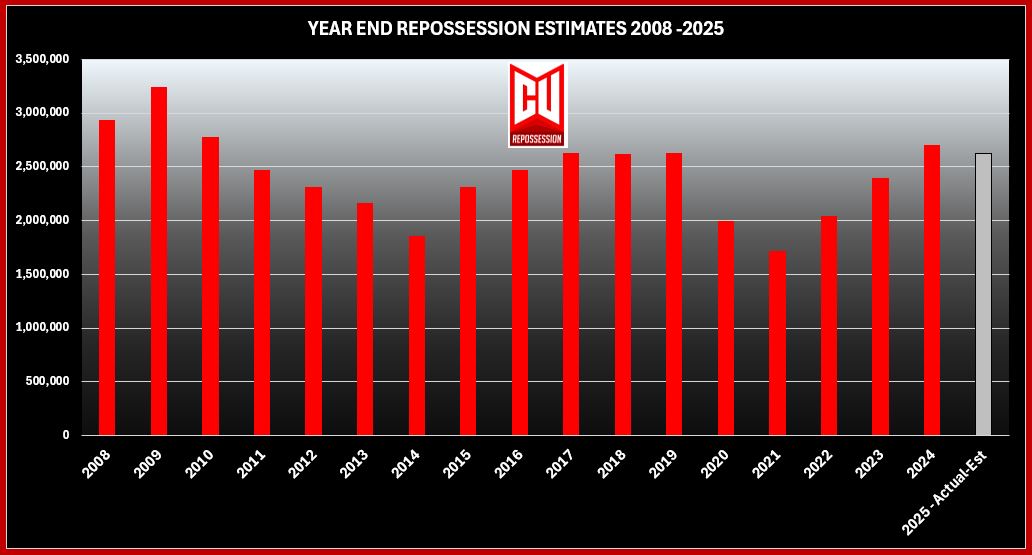
If all of these estimates hold up, we can expect to finish 2025 just behind last year with 2,626,318 repossessions. A minor decrease, but still a very strong year.
Conclusions:
I have been researching and studying the repossession industry for several years now and have discovered long ago just how elusive data on the industry is. But in the effort to create baseline data of industry standards for measurement, I have endeavored to take on this task. Finding accuracy in predictable modeling data is impossible without actual transactional level data from the repo industry services providers.
Just last week I reported the Bureau of Labor Statistics (BLS) data for Q3 2024 number of repossession agencies as 861 with 7,358 employees, I knew the numbers were way off tehn. I suspect it is more than twice this. Just another inefficient Federal agency gathering garbage data I suppose.
With little more than brief anecdotal clips to give glimpses of historical repossession volume, we did manage to discover some method to the madness and created some backfill to cover the last 16 years of repossession volume. First, relying upon Cox Automotive data reports and discovering their model, we have managed to develop some predictable seasonal modeling.
But after receiving the hard data from RDN, we may have the most reliable data possible, at least at this time. I genuinely appreciate the assistance from RDN with this. Their contribution is priceless!
One reader had suggested I bring MBSi into the model, but that would require the actual account level data from both at the VIN level in order to remove duplicates. That’s a pretty steep order. I seriously doubt that I could get that from either and I can’t blame them. This illustrates just how many other venues for assignment and reporting exist.
Truth be told, my numbers are probably still a little on the low side and they could be as much as a half-million a year higher. It will be interesting to see how close the real repossession volumes in Q2 of 2025 come to the estimates. Either way, we at least now have some method of measuring the health of the auto lending community, the repossession industry and all of the important elements of this industry that rely on it.
Kevin Armstrong
Publisher
Related Articles:
Uncovering the True Size of the Repossession Industry in 2024
Repossession Assignment Volume UPDATED – 2008-2024
2008 -2024 Repossession Volume – 17 Years of Crisis and Comeback
CFPB Issues First Detailed Repossession Data Report
Repossession Volume Remains Strong in Q1 25’ – Repossession Volume Remains Strong in Q1 25’ – Repossession Volume Remains Strong in Q1 25’ – Repossession Volume Remains Strong in Q1 25’ – Repossession Volume Remains Strong in Q1 25’
Repossession Volume Remains Strong in Q1 25’ – Repossess – Repossession – Repossession Agency – Repossessor


More Stories
Unsustainable Now: The Fuel Cost Surge Threatening the Survival of Repo Agents
The Tale of the LPR Network
Fuel Crisis in Repossession: The Numbers Don’t Lie
When Information Becomes Influence
Lenders: A Repossession is a Repossession – Ignore This at Your Own Peril
Agent Advisory Boards: Valuable Dialogue, But Where’s the Structural Shift?