


A Gift from the CFPB and RDN
Now that I thought I’d finally developed some baseline ideas on how many repossessions there have been per year and by state, I got thrown some new numbers from a more reliable source! Turns out the volume was almost 50% higher. With that, I’ve not only updated the volumes but backed into some data provided to us by our friends at the CFPB. These insights provide us with some rationale to understand just how many repossessions have been assigned over that same period of time.

Back on March 10th, we issued our repossession volume estimates in the story 2008 -2024 Repossession Volume – 17 Years of Crisis and Comeback. Based upon the methods used by Cox Automotive, we reported that a total of 1.88M vehicles were repossessed in 2024.
Using many other data points and industry quotes on the topic through the years, we also managed to backfill the data to provide a clearer estimate of completed repossessions throughout that same period.
Last week, we looked at population density, numbers of registered vehicles and average FICO score distributions by state, we were able to estimate the repo volumes by state.
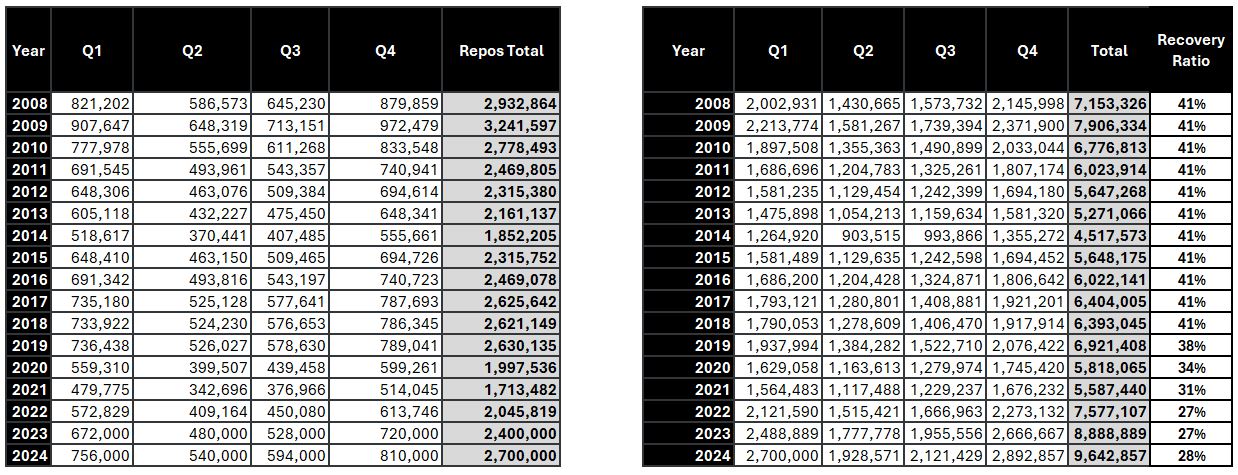
Discussing these numbers with a friend in the forwarding industry, he had provided me some data on the topic that stated in 2024 there were 2.2M recoveries and 9.2M assignments. Following up with another very reliable source, he had told me that he heard from Recovery Database Network (RDN) that 2024 actually had 2.7M repossessions and 9.7M assignments. He also added that 2023 had 2.4M with 8.9M assigned.
This is an average 51% higher than the first estimates! Back to the drawing board.
I’d rather get the numbers right than be right, so I’m going to run with these changes. What this also did was provide the recovery ratios for each year, which were more than coincidental, in line with the CFPB’s January findings in their Repossession in Auto Finance report. So now that we have six years of data on recovery ratios we can now get an estimate of how many repossessions were assigned.
Adding the CFPB Data
In the CFPB’s January repossession report, they quoted the following:
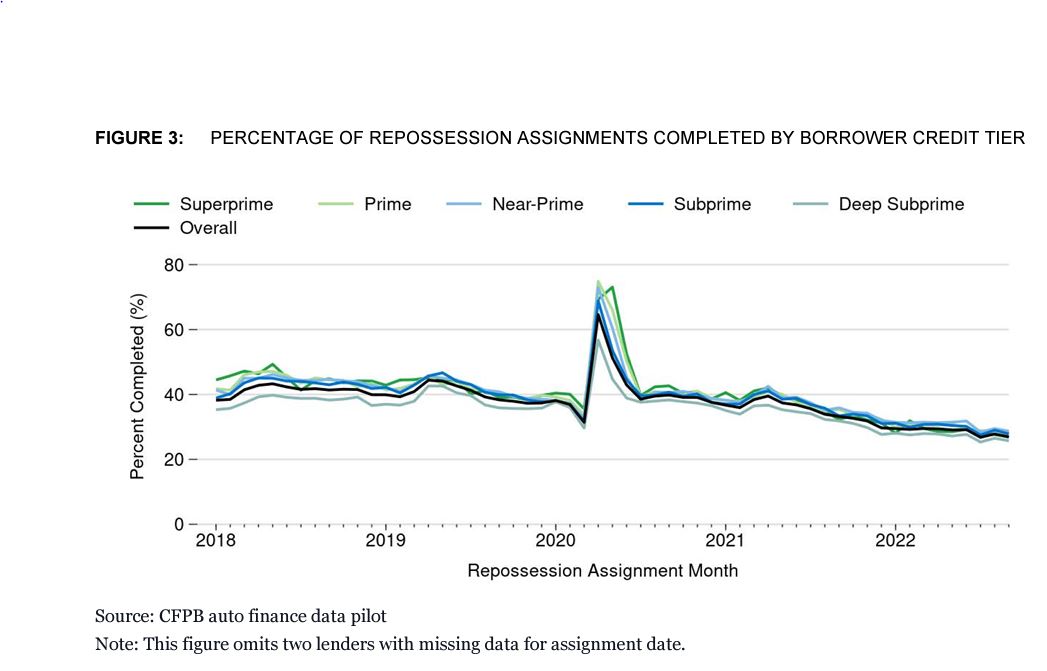
2.3 Completed Repossessions
In Figure 3 we look at the percentage of assigned repossessions completed by credit tier. Prior to 2020, lenders in the dataset completed 41 percent of all repossessions assigned in an average month. Within all credit tiers, and consistent with overall repossession trends in this dataset as discussed earlier in the report, the percentage of completed repossessions spiked in April 2020 due to the high number of voluntary repossessions that month. By the beginning of 2021, the percentage of completed repossessions for all credit tiers returned to pre-pandemic levels before experiencing a general decline through 2021 and 2022, with 27 percent of repossession assignments completed in September 2022.
The CFPB’s data is not perfect, no one data set is going to be. This data only came from nine lenders (three banks, three finance companies, and three captive lenders.) While not a complete picture of the lending world and despite our not knowing who exactly they are, it is a fairly large data pool and arguably worthy of applying their findings to our study.
Of note was a steep decline in completed repossessions; an average 41% recovery rate from January 2018 to April of 2021 and a 27% recovery rate in 2022.
This 27% recovery ratio is the same as RDN’s estimate for 2023 and 2024’s 28%.
Recovery rates over a period of time are data gold in finding out how many were assigned.
At First Glance
These recovery rate numerators are significant when applied to the repossession total of those years. Applying those numbers to those specific years, e.g.; 2.6M repossession in 2018 with a 41% recovery rate would mean that there were 6.4M repossessions assigned. Furthermore, we can assume that with a 27% recovery rate in 2022, when there were an estimated 2M repossessions completed, there would have been 7.5M assignments.
So far, we have a four-year data period showing recovery ratios. Were they better or worse before? Who knows, but I am pretty sure they were better than current era. So, for the sake of consistency, lets just assume they were always 41% before 2018 and let’s use the CFPB numbers for 2018-2022 and the RDN numbers from 2023-2024.
With those assumptions, it looks pretty straightforward, right? Wrong! This fails to bring in another important factor.
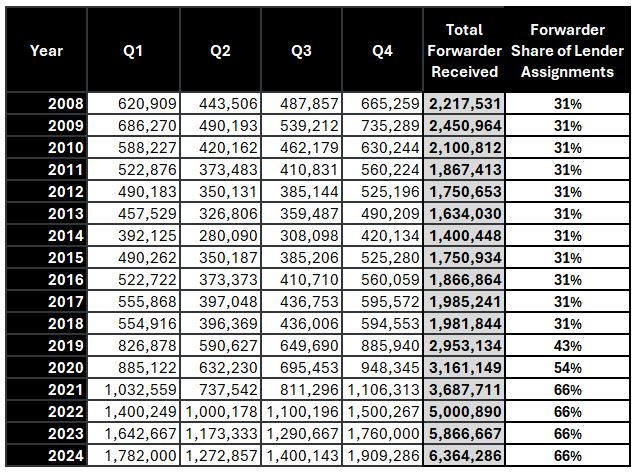
Forwarders and Staging
Also included in the CFPB’s report was this statement in the Executive Summary that stated the following:
The use of third-party repossession and recovery management services (referred to as “repossession forwarders” later in this report) by lenders in the dataset increased from 31 percent at the beginning of the data collection in January 2018 to 66 percent at the end of the data collection in December 2022. Outside a spike during the pandemic, use of repossession forwarders peaked at 69 percent in October 2022.
So, with that statement, we know that 31% of these assignments went to a forwarder in 2018, spiked at 69% in October of 22’ and ended in 22’ at 66%. The significance of this is in forwarder staging strategies.
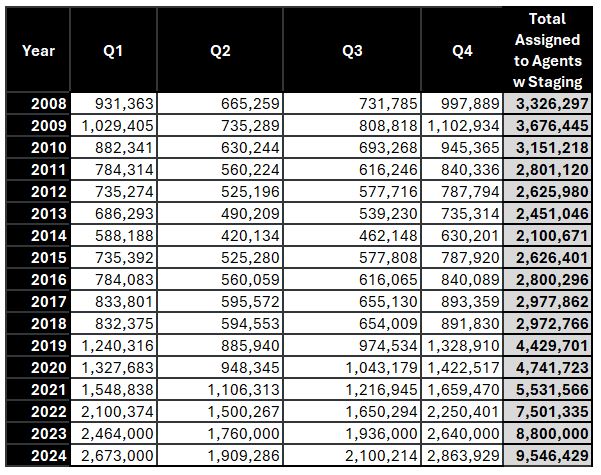
Forwarders often employ a three-tiered staging strategy that gives first placement (we’ll use 10 days as a working number for each stage). These will vary by forwarder and circumstance. Of course, at the end is the cherry on top, LPR staging, which could come in at any point, but that’s too much deviation from the topic for this study.
The CFPB also reported:
The average number of days between repossession assignment and completion ranged from 15.9 days for consumers with superprime credit scores to 23.1 days for consumers with subprime credit scores.
Taking those two numbers as an average, we come up with 19.5 days from assignment to recovery. That lays the average recovery in the tier 2 stage. But not to overstate this figure, I’ve softened it by 1.5 secondary assignments versus two.
That means, on average, the aforementioned forwarder assignments went to at least one and a half repossession agencies. This increases the actual number of forwarder to agency assignments.
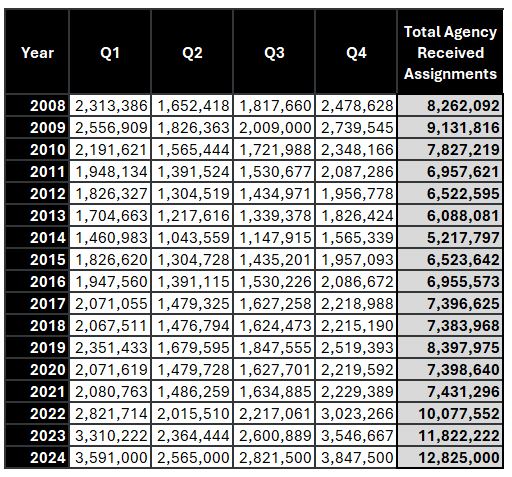
This massively inflates the total agency assignment volume from e.g.;
- 2022 – an estimated 7.5M assignments were sent out by lenders.
- 66% went to forwarders = 5M.
- 33% were sent direct to agencies by the lenders = 2.5M.
- The average recovery time is just under 20 days which means that forwarder to agency assignments would on average been in a second-tier stage and would have been assigned 1.5 times by the time of recovery.
- With the second tier added, the 5M assignments to forwarders to agents blows up to 7.5M agency assignments from forwarders.
- Combining the forwarder assignment volume to the agents (7.5M) and the direct lender to agency volume (2.5M), the closer number to reality of assignments received by agencies for that year is 10M.
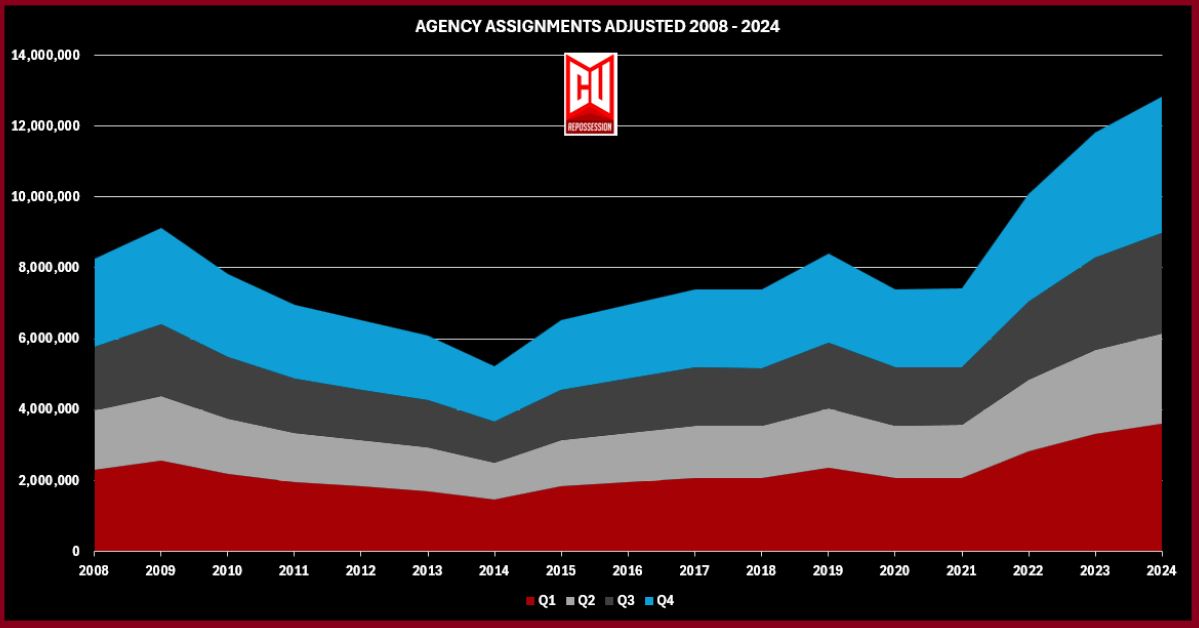
Seasonality
As frequently said, repossessions, like delinquency, aren’t random and do follow a pattern. Most everyone knows these cycles either numerically or intuitively. Data backs it up and provides us the following ratios and reasons:
- Winter (Q1): 28% of the haul. Post-holiday defaults. January’s a killer before tax refunds hit. Think of 2009’s all-time high 603,000 repos in Q1.
- Spring (Q2): 20%, the slow season. Tax checks averaging $3,000 (IRS, 2023) ease the borrower’s pain. 2015’s 300,000 units was moderate breather from Q1.
- Summer (Q3): 22%, a middle grind. Back-to-school costs nudge it up. In 2019, 391,000 cars were recovered followed by 493,000 in Q4.
- Fall (Q4): 30%, Showtime! Holiday spending plus year-end lender pressure to close the books strong. Consistently the busiest quarter of the year.
This rhythm’s held steady from 2008’s pre- housing meltdown chaos to today, bending only for shocks like 2009’s Q1 spike or 2020’s Q2 drop. These same patterns can be seen in delinquency patterns, and for good reasons. Using these, we can back fill the year end total estimates by quarter.
The Reveal
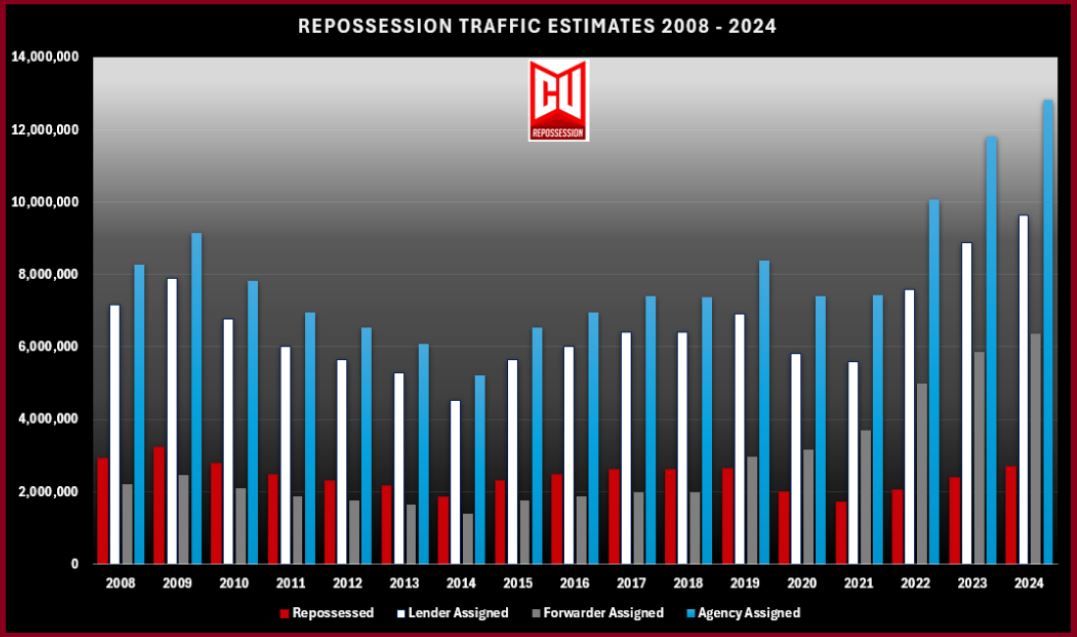
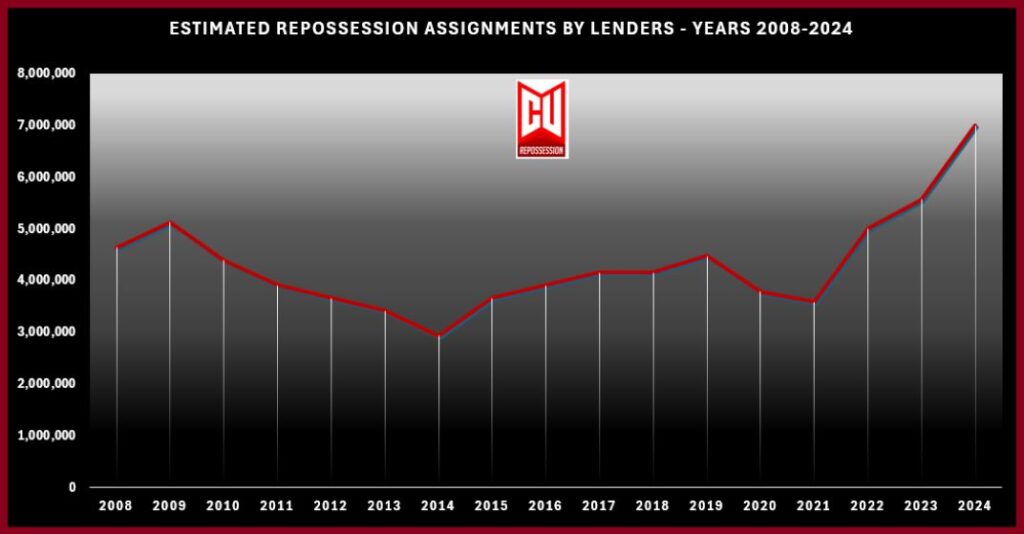
Based on these assumptions we can see the total amounts of repossession volume and traffic to and from each of the three major industry segments (lenders, forwarders and repossession agencies) through the years.
Perhaps the most notable data point is the declining recovery rates. Using only the CFPB’s exam period of 2018 to 2022, we were provided a decline from 41% to 27% in 2022. Averaging it out at -3% per year over that period, it shows a significant decline.
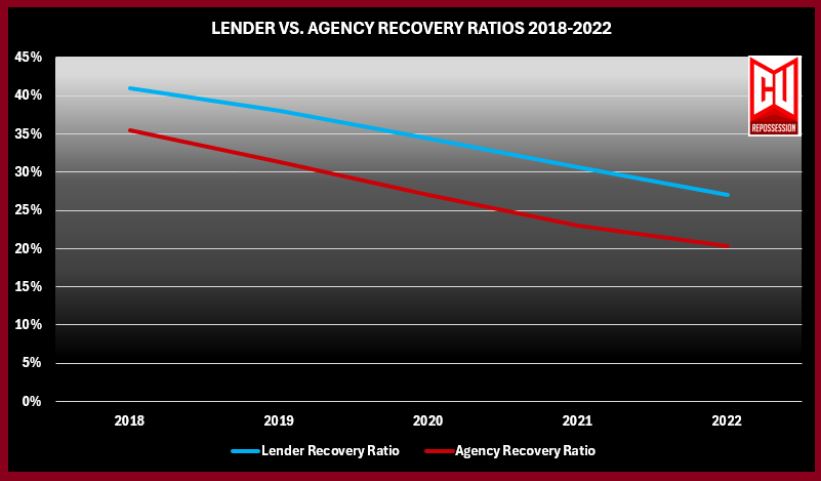
From an agency standpoint, once we add in the forwarder contribution by tiered strategy, the recovery ratios drop another 6%-7% on average over the period of study.
These declining ratios seem to infer a high amount of inefficiency. But then again, when the lenders never complained when their recovery ratios slipped 14% over a four-year period, it seems pretty obvious that they either aren’t concerned or just aren’t paying attention.
Assumptions
Of course, these assumptions are all based upon other assumptions.
- The Cox Automotive/Manheim estimates used for total repossession volume.
- The recovery ratios provided by the CFPB
- The forwarder assigned ratios also provided by the CFPB
- The days from assignment to recovery data also from the CFPB
- Assumptions of forwarder tier strategies.
- A flatline on recovery ratios and forwarder assigned volume both before and after the CFPB exam window of 2018 to 2022.
- RDN data may be on their own internal data alone and contains noo other assumptions. IN this case, the numbers would be higher yet to account for all of the assignments that do not go into RDN.
I can’t say enough how important RDN’s new reported data is. This and the CFPB’s report was very illuminating in showing the repossession practices and results by these nine lenders. I wish they could have included more and perhaps gone deeper into LPR recoveries, but that, along with lenders capturing data on the staging strategies employed by their forwarders, is something that I doubt many, if any lenders maintain.
Unfortunately, with DOGE gutting out the CFPB, I doubt that we’ll get to see another of these. It created a nice baseline of information. In my opinion, was the greatest thing the CFPB ever did for the repossession industry.
The big takeaway to me was the steep decline in recovery ratios. This also leads me to wonder a few other things that will be even harder to get my arms around;
- Are there really that many unrecovered cars out there?
- Are lenders assignment strategies partly to blame?
- Are agencies themselves just not running the accounts as frequently?
- With so many assignments, are agencies themselves just not running the accounts as frequently?
- Are recovery turn times being effected by overwhelmed agencies “cherry-picking” assignments?
These are all very difficult issues to find the answers to, but I suspect many of these are in play. I have my theories, but it all suggests a great deal of inefficiency is present, but that’s another story.
Kevin Armstrong
Publisher
Related Articles:
Repossession Volume by State 2024
2008 -2024 Repossession Volume – 17 Years of Crisis and Comeback
CFPB Issues First Detailed Repossession Data Report
Repossession Assignment Volume UPDATED – 2008-2024 – Repossession Assignment Volume UPDATED – 2008-2024 – Repossession Assignment Volume UPDATED – 2008-2024 – Repossession Assignment Volume UPDATED – 2008-2024 – Repossession Assignment Volume UPDATED – 2008-2024 – Repossession Assignment Volume UPDATED – 2008-2024 – Repossession Assignment Volume UPDATED – 2008-2024 – Repossession Assignment Volume UPDATED – 2008-2024 – Repossession Assignment Volume UPDATED – 2008-2024
Repossession Assignment Volume UPDATED – 2008-2024 – Repossess – Repossession – Repossession Agency – Repossessor


More Stories
Unsustainable Now: The Fuel Cost Surge Threatening the Survival of Repo Agents
The Tale of the LPR Network
Fuel Crisis in Repossession: The Numbers Don’t Lie
When Information Becomes Influence
Lenders: A Repossession is a Repossession – Ignore This at Your Own Peril
Agent Advisory Boards: Valuable Dialogue, But Where’s the Structural Shift?