


The Largest Q2 Volume in Recorded Repo History
Q2 is traditionally the slowest quarter for repossession assignments and recoveries. But 2025 just put an end to that trend. With new data provided by John Sibbitt of Recovery Database Network (RDN) we can see that this year could be shaping up to be at least the second highest year on record for repossessions and assignments. Who knows at this rate, it could be the biggest.
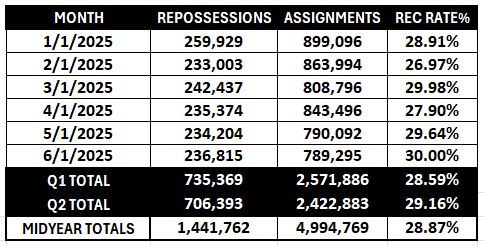
Last April we were blessed with updated repossession data from RDN that reported that repossession volume in Q1 provided 2,571,886 unique repossession assignments that resulted in 735,369 repossessions. As previously discussed, RDN’s numbers were dramatically higher than the Cox Automotive model data that reported 49% lower repossession volume than what was ACTUALLY being assigned and repossessed by RDN.
It was a no-brainer. We’re running with RDN’s numbers.
Assignment Volume
According to RDN’s data, there were 2,422,883 unique repossession assignments received in the second quarter of the year. In other words, no two assignments were sent on the same vehicle.
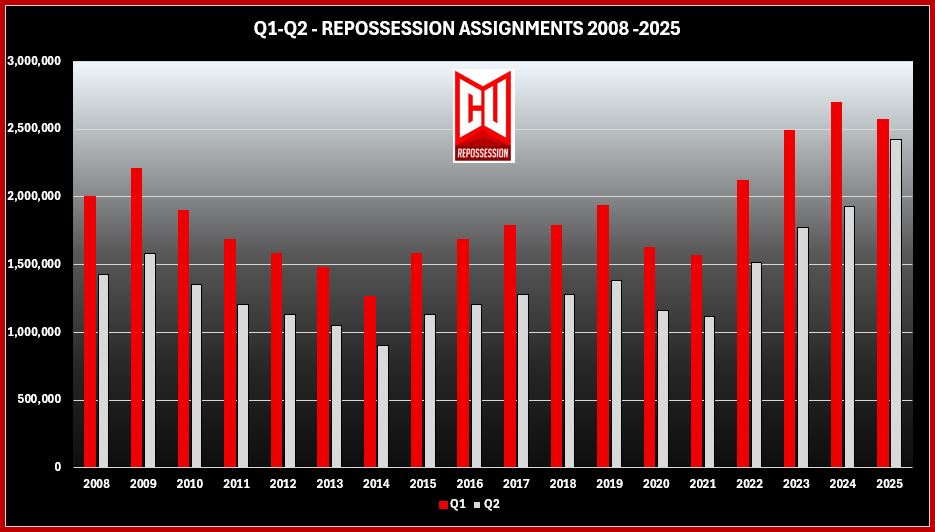
- April started strong with 843,496
- May, showed a slight drop to 790,092.
- June showed another reduction down to 789,295
While month after month did show reductions in assignment volume, it was a mere 6% lower than Q1 but still 20% higher than Q2 of 2024. With the summer months in full swing, it’s reasonable to suggest that the second half of the year will be busier.
I had predicted that Q2 would end with 1,837,161 vehicles assigned. I was way off!
Even more, these are unique repossession assignments. No two assignments were sent on the same vehicle. That is not the case for most of the 66% or more forwarder assignments that are assigned through a tiered assignment strategy that could double this number in terms of the actual volume received by repossession agencies.
Recovery Ratios
Repo assignment volume is meaningless unless the collateral is being recovered. As mentioned in our last report, RDN had reported a recovery ratio of 27% for 2023 and 28% for 2024. These number have barely budged in Q2 which finished combined at 29%.
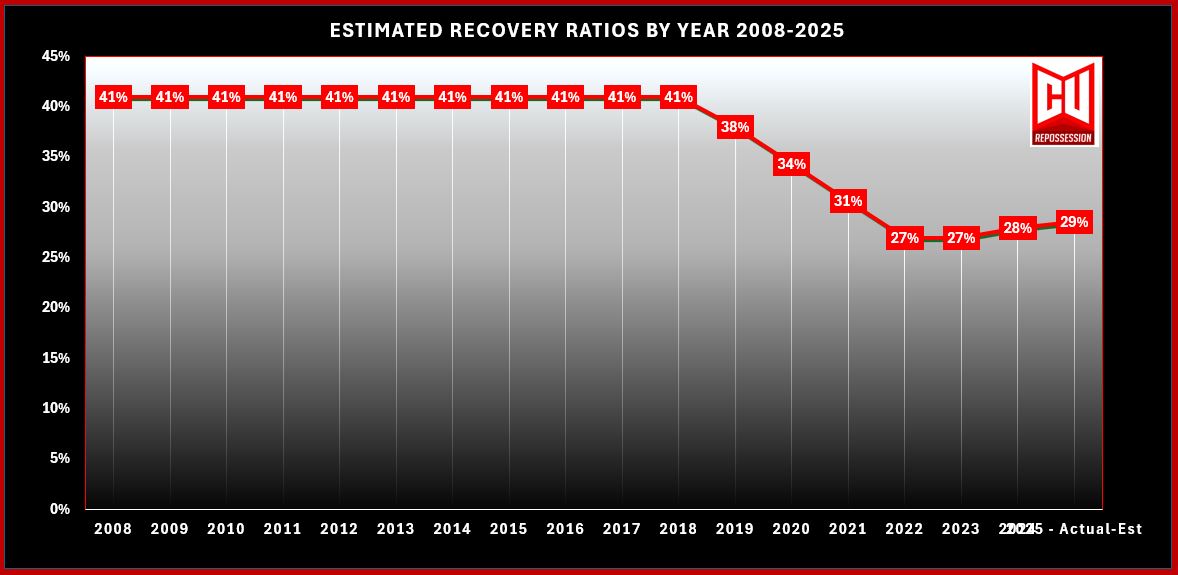
According to RDN, in Q1 of 2025, this ratio improved to 29%. Likewise, by June of 2025, this ratio improved to 30%. Call it progress, but it is still a far cry from the CFPB’s reported rate of 41% for the periods of January 2018 to April of 2021.
Repossession Volume
With a stubborn 29% recovery ratio for the quarter, Q2 ended with 706,393 repossessions.
- April dropped from March with 235,374
- May, dropped to 234,204.
- June, picked back up with 236,815
June showing an increase is par for the seasonal course. This was the third highest recovery month of the year and showed a 30% recovery ratio.
I had predicted this quarter to provide a mere 525,264 vehicles repossessed. Again, much, much lower than predicted.
Looking Ahead
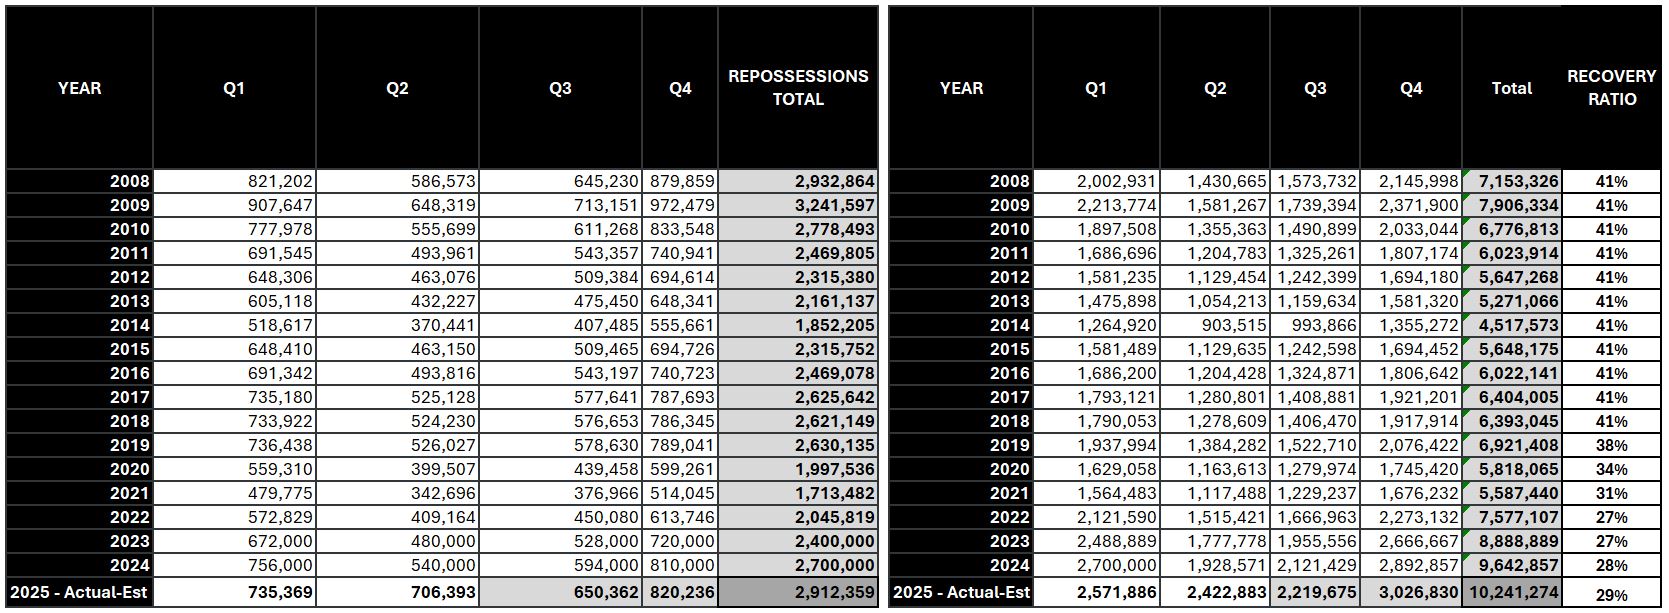
Q1 and Q2 contain 48% of all the repossessions according to the Cox Automotive model. Until I see better data on these ratios, I’ll stick with it. That means that we should the other 52% coming at us throughout the rest of the year.
Assignments:
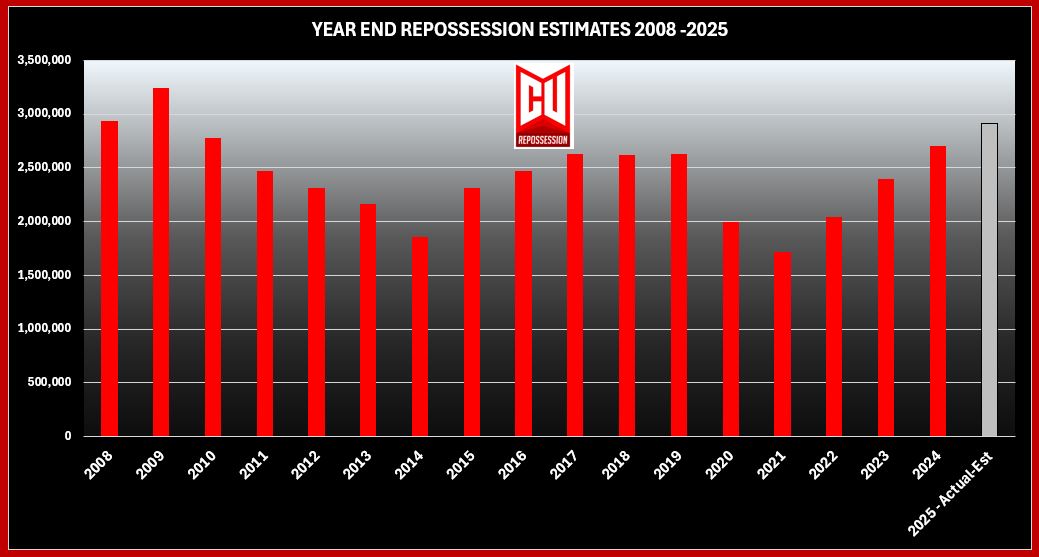
Q3 – With 22% of the average annual repo assignment volume, this quarter should end with 2,219,675 vehicles assigned.
Q4 – An estimated whopping 30% of annual recoveries, should end with 3,026,830 assignments.
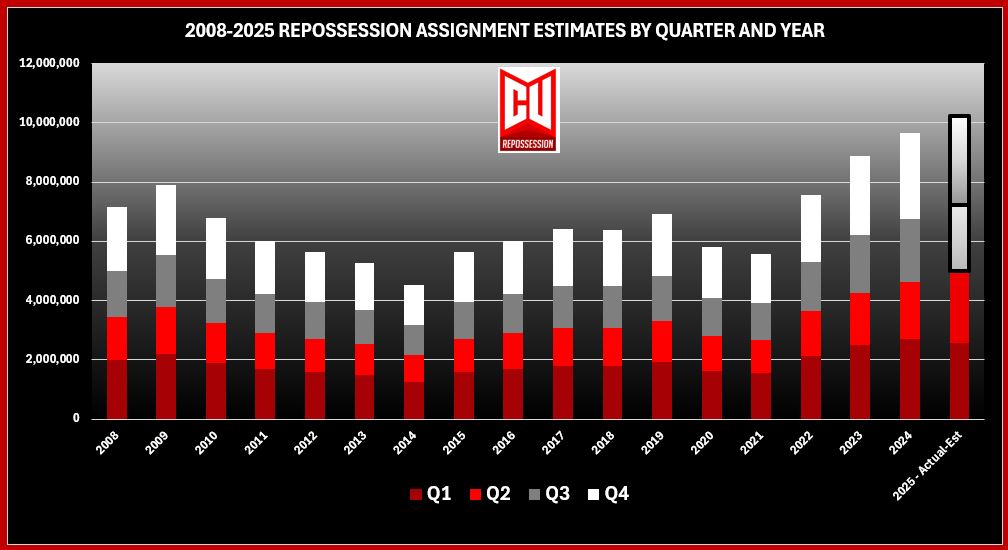
If all goes as expected, will end the year 10,241,274 assignments. The highest on record!
Repossessions:
Q3 – Sticking with the same 22% repossession volume ratio, this quarter should end with 650,362 vehicles repossessed. The highest Q3 since 2009.
Q4 – Using the 30% estimate of annual recoveries, this final quarter should finish with 820,236 recoveries.
Assuming all of this stacks up as expected, we can expect to finish 2025 as the new third highest year on record. Second only to 2009 and 2008.
Conclusions:
I have been researching and studying the repossession industry for several years now and have discovered just how elusive data on the industry is. Earlier this year I reported the Bureau of Labor Statistics (BLS) data for Q3 2024 number of repossession agencies as 861 with 7,358 employees, I knew the numbers were way off and when the end of the year numbers coming out flat, I just left it where it was. I still suspect it is more than twice this.
First, relying upon Cox Automotive data reports and discovering their model, we have managed to develop some predictable seasonal modeling. But after receiving the hard data from RDN, we may have the most reliable data possible, at least at this time. I genuinely appreciate the assistance from RDN with this. Their contribution is priceless!
Of course, these numbers are probably still a little on the low side and they could be as much as a half-million a year higher. As it turned out, my Q2 assignment volume predictions were low but the repossession volume was considerably lower.
It’s not a perfect science, but it is getting better. At least now have some method of measuring the health of the auto lending community, the repossession industry and all of the important elements of this industry that rely on it.
Kevin Armstrong
Publisher
Related Articles:
Repossession Volume Remains Strong in Q1 25’
Uncovering the True Size of the Repossession Industry in 2024
Repossession Assignment Volume UPDATED – 2008-2024
2008 -2024 Repossession Volume – 17 Years of Crisis and Comeback
CFPB Issues First Detailed Repossession Data Report
RDN Repossession Volume Report – Q2 2025 – RDN Repossession Volume Report – Q2 2025 – RDN Repossession Volume Report – Q2 2025
RDN Repossession Volume Report – Q2 2025 – Repossess – Repossession – Repossession Agency – Repossessor – RDN – Recovery Database Network


More Stories
The Tale of the LPR Network
Wrongful Death Lawsuit Over 2023 Repossession Shooting Dismissed
Fuel Crisis in Repossession: The Numbers Don’t Lie
When Information Becomes Influence
Close Call in Detroit: Toddler Left in Repossessed Vehicle, Safely Returned
Lenders: A Repossession is a Repossession – Ignore This at Your Own Peril